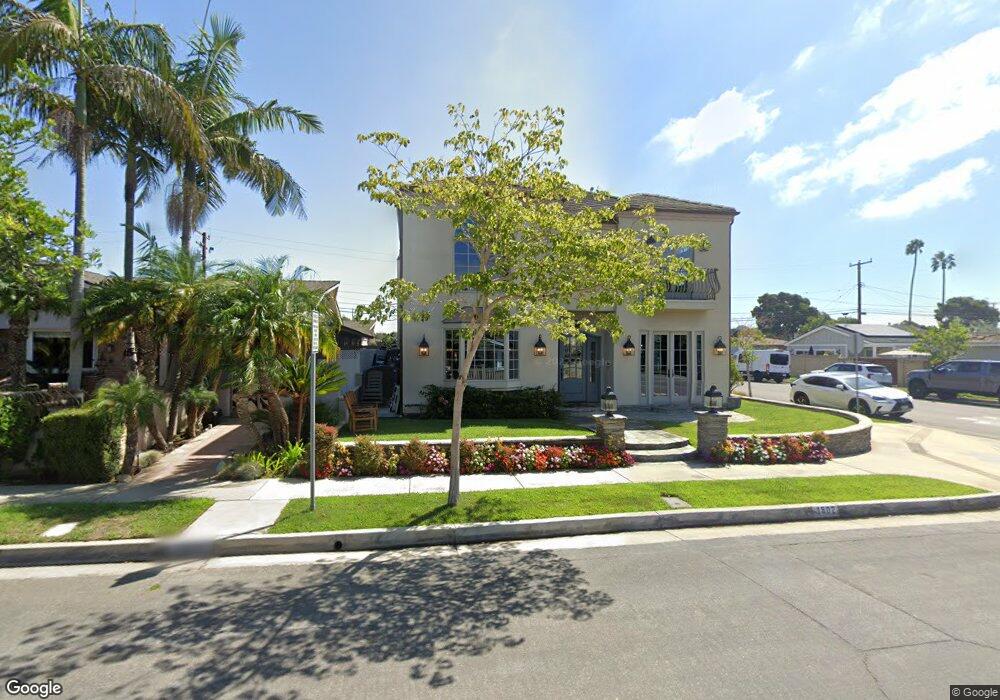
1802 Pine St Huntington Beach, CA 92648
Estimated Value: $2,967,022 - $4,439,000
4
Beds
4
Baths
4,017
Sq Ft
$870/Sq Ft
Est. Value
About This Home
This home is located at 1802 Pine St, Huntington Beach, CA 92648 and is currently estimated at $3,494,756, approximately $869 per square foot. 1802 Pine St is a home located in Orange County with nearby schools including Agnes L. Smith Elementary, Ethel Dwyer Middle, and Huntington Beach High School.
Ownership History
Date
Name
Owned For
Owner Type
Purchase Details
Closed on
Jun 3, 2020
Sold by
Miller Daniel S and Miller Kendra D
Bought by
Miller Kendra D and Miller Daniel S
Current Estimated Value
Home Financials for this Owner
Home Financials are based on the most recent Mortgage that was taken out on this home.
Original Mortgage
$1,260,000
Interest Rate
2.9%
Mortgage Type
Purchase Money Mortgage
Purchase Details
Closed on
Feb 8, 2018
Sold by
Miller Daniel S and Miller Kendra Dawn
Bought by
Miller Daniel Stewart and Miller Kendra Dawn
Purchase Details
Closed on
Mar 21, 2005
Sold by
Smith Victor and Bahnsen Christine M
Bought by
Miller Daniel S and Miller Kendra D
Home Financials for this Owner
Home Financials are based on the most recent Mortgage that was taken out on this home.
Original Mortgage
$734,000
Interest Rate
5.37%
Mortgage Type
Purchase Money Mortgage
Purchase Details
Closed on
Nov 4, 1993
Sold by
World S & L Assn
Bought by
Smith Victor and Bahnsen Christine M
Home Financials for this Owner
Home Financials are based on the most recent Mortgage that was taken out on this home.
Original Mortgage
$200,000
Interest Rate
6.74%
Create a Home Valuation Report for This Property
The Home Valuation Report is an in-depth analysis detailing your home's value as well as a comparison with similar homes in the area
Home Values in the Area
Average Home Value in this Area
Purchase History
| Date | Buyer | Sale Price | Title Company |
|---|---|---|---|
| Miller Kendra D | -- | First American Title Ins | |
| Miller Daniel Stewart | -- | None Available | |
| Miller Daniel S | $917,500 | Chicago Title Co | |
| Smith Victor | $260,000 | Old Republic Title Company |
Source: Public Records
Mortgage History
| Date | Status | Borrower | Loan Amount |
|---|---|---|---|
| Previous Owner | Miller Kendra D | $1,260,000 | |
| Previous Owner | Miller Daniel S | $734,000 | |
| Previous Owner | Smith Victor | $200,000 |
Source: Public Records
Tax History Compared to Growth
Tax History
| Year | Tax Paid | Tax Assessment Tax Assessment Total Assessment is a certain percentage of the fair market value that is determined by local assessors to be the total taxable value of land and additions on the property. | Land | Improvement |
|---|---|---|---|---|
| 2025 | $22,027 | $2,008,615 | $1,156,671 | $851,944 |
| 2024 | $22,027 | $1,969,231 | $1,133,991 | $835,240 |
| 2023 | $21,541 | $1,930,619 | $1,111,756 | $818,863 |
| 2022 | $20,979 | $1,892,764 | $1,089,957 | $802,807 |
| 2021 | $20,585 | $1,855,651 | $1,068,585 | $787,066 |
| 2020 | $20,454 | $1,836,624 | $1,057,628 | $778,996 |
| 2019 | $20,203 | $1,800,612 | $1,036,890 | $763,722 |
| 2018 | $19,889 | $1,765,306 | $1,016,558 | $748,748 |
| 2017 | $19,624 | $1,730,693 | $996,626 | $734,067 |
| 2016 | $18,733 | $1,696,758 | $977,084 | $719,674 |
| 2015 | $18,558 | $1,671,272 | $962,408 | $708,864 |
| 2014 | $17,969 | $1,620,140 | $943,556 | $676,584 |
Source: Public Records
Map
Nearby Homes
- 1821 Lake St
- 1828 Pine St
- 1824 Park St
- 1701 Lake St
- 118 Adams Ave
- 1915 Pine St
- 1112 Park St
- 219 Portland Ave
- 215 Wichita Ave Unit 106
- 19662 Stern Ln
- 19561 Pompano Ln Unit 106
- 19562 Pompano Ln Unit 107
- 19562 Pompano Ln Unit 108
- 19581 Pompano Ln Unit 107
- 1425 Alpine Ln
- 19731 Estate Cir
- 19451 Pompano Ln Unit 110
- 19502 Ranch Ln Unit 112
- 945 10th St
- 949 10th St