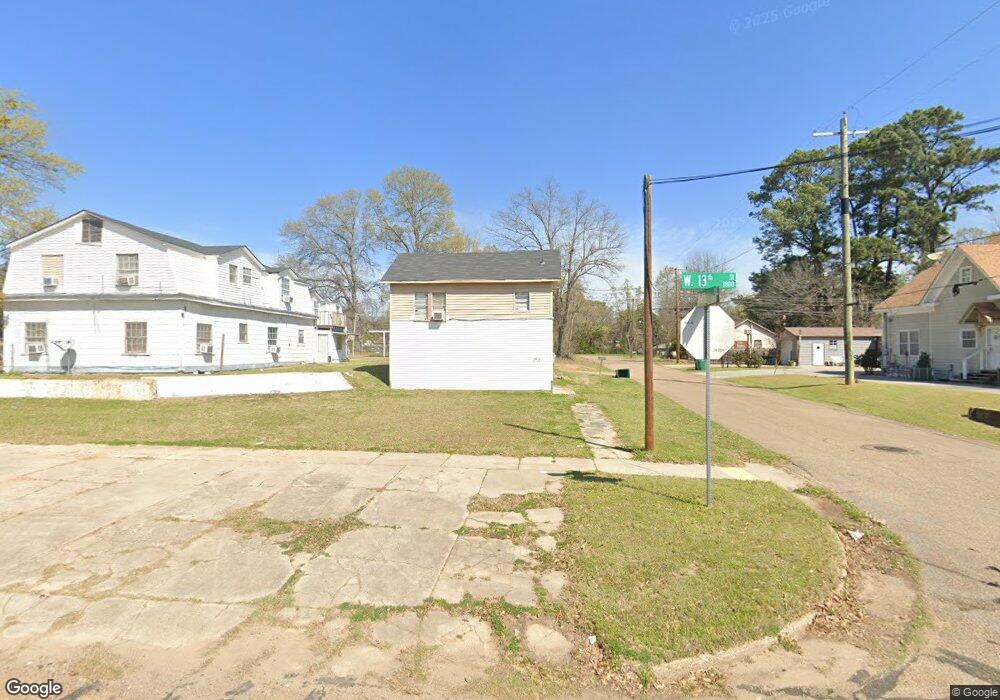
1802 W 13th St Texarkana, TX 75501
Estimated Value: $37,000 - $104,000
--
Bed
--
Bath
520
Sq Ft
$122/Sq Ft
Est. Value
About This Home
This home is located at 1802 W 13th St, Texarkana, TX 75501 and is currently estimated at $63,640, approximately $122 per square foot. 1802 W 13th St is a home with nearby schools including Theron Jones Early Literacy Center, Westlawn Elementary School, and Texas Middle School.
Ownership History
Date
Name
Owned For
Owner Type
Purchase Details
Closed on
Nov 9, 2023
Sold by
Tired Teachers Investments Llc
Bought by
Beavers Melissa Lee and Sapolio Scott Allen
Current Estimated Value
Purchase Details
Closed on
Jun 11, 2021
Sold by
Bomberger Charlotte
Bought by
Tired Teachers Investments Llc
Home Financials for this Owner
Home Financials are based on the most recent Mortgage that was taken out on this home.
Original Mortgage
$175,000
Interest Rate
2.9%
Mortgage Type
Commercial
Create a Home Valuation Report for This Property
The Home Valuation Report is an in-depth analysis detailing your home's value as well as a comparison with similar homes in the area
Home Values in the Area
Average Home Value in this Area
Purchase History
| Date | Buyer | Sale Price | Title Company |
|---|---|---|---|
| Beavers Melissa Lee | -- | Southwest Title | |
| Tired Teachers Investments Llc | -- | Southwest Title Company |
Source: Public Records
Mortgage History
| Date | Status | Borrower | Loan Amount |
|---|---|---|---|
| Previous Owner | Tired Teachers Investments Llc | $175,000 |
Source: Public Records
Tax History Compared to Growth
Tax History
| Year | Tax Paid | Tax Assessment Tax Assessment Total Assessment is a certain percentage of the fair market value that is determined by local assessors to be the total taxable value of land and additions on the property. | Land | Improvement |
|---|---|---|---|---|
| 2025 | $567 | $24,763 | $3,500 | $21,263 |
| 2024 | $567 | $23,951 | $3,500 | $20,451 |
| 2023 | $1,173 | $49,518 | $3,500 | $46,018 |
| 2022 | $1,045 | $43,758 | $3,500 | $40,258 |
| 2021 | $993 | $38,831 | $3,500 | $35,331 |
| 2020 | $942 | $36,634 | $3,500 | $33,134 |
| 2019 | $952 | $35,685 | $3,500 | $32,185 |
| 2018 | $934 | $35,010 | $3,500 | $31,510 |
| 2017 | $909 | $34,157 | $3,500 | $30,657 |
| 2016 | $904 | $33,990 | $3,500 | $30,490 |
| 2015 | $879 | $33,990 | $3,500 | $30,490 |
| 2014 | $879 | $33,990 | $3,500 | $30,490 |
Source: Public Records
Map
Nearby Homes