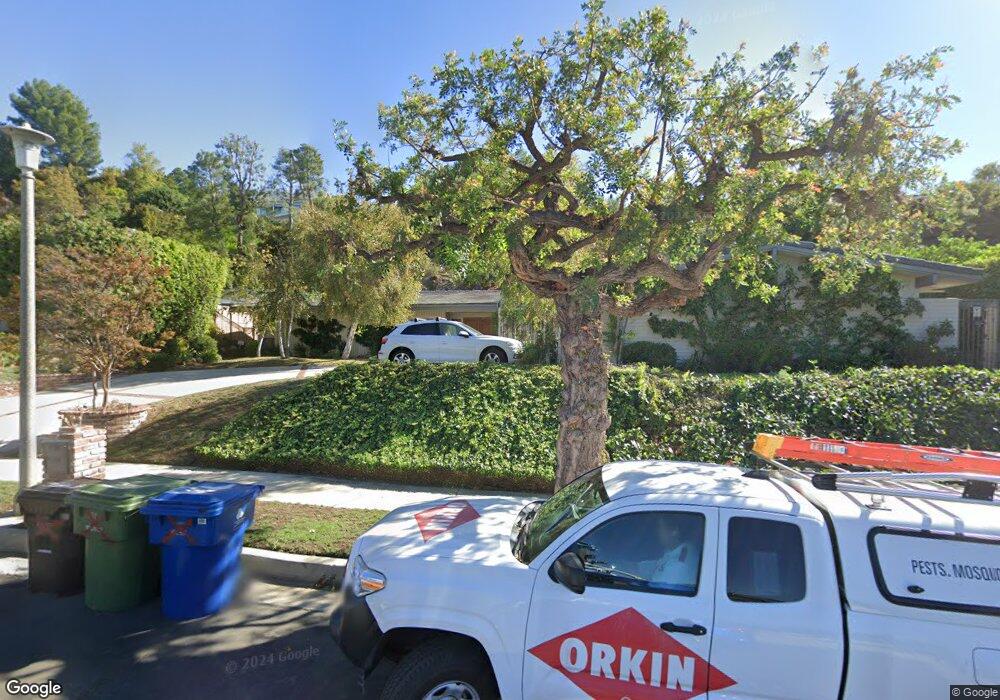
18022 Medley Dr Encino, CA 91316
Estimated Value: $1,873,831 - $2,484,000
5
Beds
4
Baths
3,316
Sq Ft
$675/Sq Ft
Est. Value
About This Home
This home is located at 18022 Medley Dr, Encino, CA 91316 and is currently estimated at $2,237,958, approximately $674 per square foot. 18022 Medley Dr is a home located in Los Angeles County with nearby schools including Gaspar De Portola Middle School, Nestle Avenue Charter, and Wilbur Charter For Enriched Academics.
Ownership History
Date
Name
Owned For
Owner Type
Purchase Details
Closed on
Sep 2, 2018
Sold by
Saltzburg Wendy and Saltzburg Bryan
Bought by
Saltzburg Wendy and Stein Saltzburg Family Trust
Current Estimated Value
Home Financials for this Owner
Home Financials are based on the most recent Mortgage that was taken out on this home.
Original Mortgage
$500,000
Interest Rate
4.7%
Mortgage Type
Purchase Money Mortgage
Purchase Details
Closed on
Feb 29, 2016
Sold by
Saltzburg Wendy and Saltzburg Bryan
Bought by
Saltzburg Joel and The Saltzburg Family Trust
Purchase Details
Closed on
Sep 1, 2008
Sold by
Saltzburg Joel
Bought by
Saltzburg Wendy and Saltzburg Bryan
Purchase Details
Closed on
Nov 22, 1991
Sold by
Saltzburg Joel and Saltzburg Susan
Bought by
Saltzburg Joel and Saltzburg Susan
Create a Home Valuation Report for This Property
The Home Valuation Report is an in-depth analysis detailing your home's value as well as a comparison with similar homes in the area
Home Values in the Area
Average Home Value in this Area
Purchase History
| Date | Buyer | Sale Price | Title Company |
|---|---|---|---|
| Saltzburg Wendy | -- | Fidelity Sherman Oaks | |
| Saltzburg Joel | -- | None Available | |
| Saltzburg Wendy | -- | None Available | |
| Saltzburg Wendy | -- | None Available | |
| Saltzburg Joel | -- | None Available | |
| Saltzburg Joel | -- | American Coast Title Co Inc |
Source: Public Records
Mortgage History
| Date | Status | Borrower | Loan Amount |
|---|---|---|---|
| Closed | Saltzburg Wendy | $500,000 |
Source: Public Records
Tax History Compared to Growth
Tax History
| Year | Tax Paid | Tax Assessment Tax Assessment Total Assessment is a certain percentage of the fair market value that is determined by local assessors to be the total taxable value of land and additions on the property. | Land | Improvement |
|---|---|---|---|---|
| 2025 | $5,087 | $382,419 | $127,460 | $254,959 |
| 2024 | $5,087 | $374,921 | $124,961 | $249,960 |
| 2023 | $4,997 | $367,570 | $122,511 | $245,059 |
| 2022 | $4,884 | $360,363 | $120,109 | $240,254 |
| 2021 | $4,811 | $353,298 | $117,754 | $235,544 |
| 2019 | $4,601 | $342,820 | $114,262 | $228,558 |
| 2018 | $4,459 | $336,099 | $112,022 | $224,077 |
| 2016 | $4,220 | $323,050 | $107,673 | $215,377 |
| 2015 | $4,163 | $318,198 | $106,056 | $212,142 |
| 2014 | $4,187 | $311,966 | $103,979 | $207,987 |
Source: Public Records
Map
Nearby Homes
- 4167 Alonzo Ave
- 4195 Alonzo Ave
- 4072 Alonzo Ave
- 18101 Green Meadow Dr
- 4406 Medley Place
- 4020 Alonzo Ave
- 4501 Grimes Place
- 18321 Lake Encino Dr
- 4326 Coronet Dr
- 18310 Karen Dr
- 4040 Hilton Head Way
- 4571 Gable Dr
- 4551 Lindley Ave
- 4551 Alonzo Ave
- 4700 Dunas Ln
- 18033 Rosita St
- 18016 Valley Vista Blvd
- 17962 Valley Vista Blvd
- 4634 White Oak Ave
- 18623 Palomino Dr
- 18028 Medley Dr
- 4163 Falling Leaf Dr
- 18012 Medley Dr
- 18034 Medley Dr
- 4151 Falling Leaf Dr
- 4179 Falling Leaf Dr
- 18015 Medley Dr
- 18025 Medley Dr
- 18006 Medley Dr
- 18035 Medley Dr
- 18001 Medley Dr
- 18048 Medley Dr
- 4141 Falling Leaf Dr
- 4174 Falling Leaf Dr
- 18051 Lake Encino Dr
- 4166 Falling Leaf Dr
- 18000 Medley Dr
- 18026 Rodarte Way
- 18049 Medley Dr