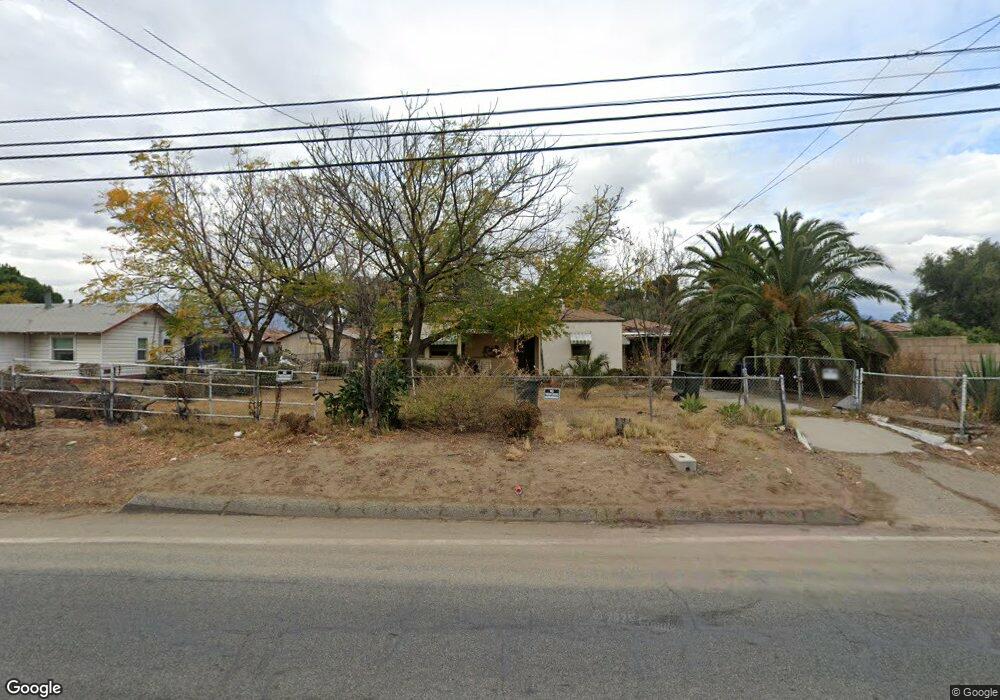
18058 Marygold Ave Bloomington, CA 92316
Estimated Value: $546,000 - $569,000
3
Beds
2
Baths
1,263
Sq Ft
$442/Sq Ft
Est. Value
About This Home
This home is located at 18058 Marygold Ave, Bloomington, CA 92316 and is currently estimated at $558,689, approximately $442 per square foot. 18058 Marygold Ave is a home located in San Bernardino County with nearby schools including Mary B. Lewis Elementary School, Joe Baca, and Bloomington High School.
Ownership History
Date
Name
Owned For
Owner Type
Purchase Details
Closed on
Aug 16, 2005
Sold by
Aday Cheryl
Bought by
Aday Timothy Arly
Current Estimated Value
Home Financials for this Owner
Home Financials are based on the most recent Mortgage that was taken out on this home.
Original Mortgage
$2,040,000
Interest Rate
5.61%
Mortgage Type
Purchase Money Mortgage
Purchase Details
Closed on
Jun 24, 2005
Sold by
Mrb Group Inc and Aylor Kim Jay
Bought by
Team 7 Properties Llc
Home Financials for this Owner
Home Financials are based on the most recent Mortgage that was taken out on this home.
Original Mortgage
$2,040,000
Interest Rate
5.61%
Mortgage Type
Purchase Money Mortgage
Purchase Details
Closed on
Oct 5, 2001
Sold by
Sung Mu Hsing and Sung Shu Chuan Yan
Bought by
Bracey Milton R and Bracey Linda R
Purchase Details
Closed on
Mar 31, 1995
Sold by
Vista Grove Fc Villa
Bought by
Sung Mu Hsing and Sung Shu Chuan Yan
Create a Home Valuation Report for This Property
The Home Valuation Report is an in-depth analysis detailing your home's value as well as a comparison with similar homes in the area
Home Values in the Area
Average Home Value in this Area
Purchase History
| Date | Buyer | Sale Price | Title Company |
|---|---|---|---|
| Aday Timothy Arly | -- | Chicago Title Company | |
| Team 7 Properties Llc | $2,400,000 | Chicago Title Company | |
| Bracey Milton R | $470,000 | First American Title | |
| Sung Mu Hsing | $227,687 | -- |
Source: Public Records
Mortgage History
| Date | Status | Borrower | Loan Amount |
|---|---|---|---|
| Previous Owner | Team 7 Properties Llc | $2,040,000 |
Source: Public Records
Tax History Compared to Growth
Tax History
| Year | Tax Paid | Tax Assessment Tax Assessment Total Assessment is a certain percentage of the fair market value that is determined by local assessors to be the total taxable value of land and additions on the property. | Land | Improvement |
|---|---|---|---|---|
| 2025 | $1,030 | $78,332 | $12,757 | $65,575 |
| 2024 | $1,030 | $76,796 | $12,507 | $64,289 |
| 2023 | $1,025 | $75,290 | $12,262 | $63,028 |
| 2022 | $1,007 | $73,814 | $12,022 | $61,792 |
| 2021 | $1,017 | $72,366 | $11,786 | $60,580 |
| 2020 | $1,015 | $71,624 | $11,665 | $59,959 |
| 2019 | $991 | $70,219 | $11,436 | $58,783 |
| 2018 | $818 | $68,842 | $11,212 | $57,630 |
| 2017 | $1,112 | $67,492 | $10,992 | $56,500 |
| 2016 | $805 | $66,168 | $10,776 | $55,392 |
| 2015 | $779 | $65,174 | $10,614 | $54,560 |
| 2014 | $745 | $63,897 | $10,406 | $53,491 |
Source: Public Records
Map
Nearby Homes
- 18042 Marygold Ave
- 9649 Grace St
- 18325 El Molino St
- 9562 Locust Ave
- 9838 Alder Ave
- 9824 Linden Ave
- 9823 Lombardy Ave
- 17514 Valley Blvd
- 17455 Marygold Ave
- 17468 Grevillea St
- 9971 Cedar Ave
- 9967 Cedar Ave
- 18264 Pine Ave Unit a & B
- 18264 Pine Ave
- 17377 Valley Blvd Unit 19
- 17377 Valley Blvd Unit 43
- 17400 Valley Blvd Unit 43
- 17400 Valley Blvd Unit 6
- 10134 Cedar Place
- 806 S Sandalwood Ave
- 9898 Locust Ave
- 18061 Marygold Ave
- 9905 Frankfort Ave
- 18071 Marygold Ave
- 9866 Locust Ave
- 18081 Marygold Ave
- 9915 Frankfort Ave
- 18087 Marygold Ave
- 18018 Marygold Ave Unit A
- 9925 Frankfort Ave
- 9840 Locust Ave
- 18006 Marygold Ave Unit B
- 18006 Marygold Ave Unit A
- 9926 Locust Ave
- 9935 Frankfort Ave
- 9936 Locust Ave
- 18104 Marygold Ave
- 9930 Frankfort Ave
- 9830 Locust Ave
- 9855 Locust Ave