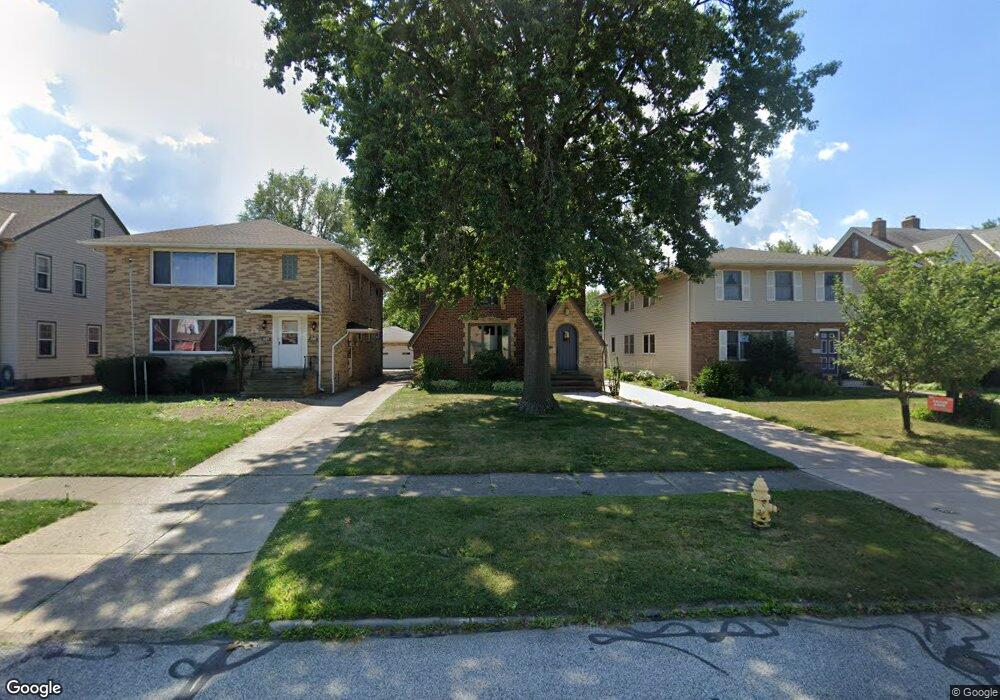
1807 Brookview Blvd Cleveland, OH 44134
Estimated Value: $183,000 - $239,000
2
Beds
1
Bath
1,314
Sq Ft
$155/Sq Ft
Est. Value
About This Home
This home is located at 1807 Brookview Blvd, Cleveland, OH 44134 and is currently estimated at $203,739, approximately $155 per square foot. 1807 Brookview Blvd is a home located in Cuyahoga County with nearby schools including John Muir Elementary School, Hillside Middle School, and Normandy High School.
Ownership History
Date
Name
Owned For
Owner Type
Purchase Details
Closed on
Nov 15, 2002
Sold by
Biagiotti David and Biagiotti Marissa
Bought by
Kosicki Anna C
Current Estimated Value
Home Financials for this Owner
Home Financials are based on the most recent Mortgage that was taken out on this home.
Original Mortgage
$114,300
Outstanding Balance
$48,157
Interest Rate
6.1%
Estimated Equity
$155,582
Purchase Details
Closed on
Jul 21, 1997
Sold by
Parks Stanley N
Bought by
Biagiotti David and Biagiotti Marissa
Home Financials for this Owner
Home Financials are based on the most recent Mortgage that was taken out on this home.
Original Mortgage
$74,000
Interest Rate
7.48%
Mortgage Type
New Conventional
Purchase Details
Closed on
Mar 8, 1985
Sold by
Schmidt Dale R
Bought by
Parks Stanley N
Purchase Details
Closed on
Jan 1, 1975
Bought by
Pagan Marie A
Create a Home Valuation Report for This Property
The Home Valuation Report is an in-depth analysis detailing your home's value as well as a comparison with similar homes in the area
Home Values in the Area
Average Home Value in this Area
Purchase History
| Date | Buyer | Sale Price | Title Company |
|---|---|---|---|
| Kosicki Anna C | $135,000 | Stewart Title | |
| Biagiotti David | $94,000 | -- | |
| Parks Stanley N | $54,000 | -- | |
| Schmidt Dale R | -- | -- | |
| Pagan Marie A | -- | -- |
Source: Public Records
Mortgage History
| Date | Status | Borrower | Loan Amount |
|---|---|---|---|
| Open | Kosicki Anna C | $114,300 | |
| Previous Owner | Biagiotti David | $74,000 |
Source: Public Records
Tax History Compared to Growth
Tax History
| Year | Tax Paid | Tax Assessment Tax Assessment Total Assessment is a certain percentage of the fair market value that is determined by local assessors to be the total taxable value of land and additions on the property. | Land | Improvement |
|---|---|---|---|---|
| 2024 | $3,292 | $53,725 | $11,095 | $42,630 |
| 2023 | $2,966 | $41,590 | $8,510 | $33,080 |
| 2022 | $2,937 | $41,580 | $8,510 | $33,080 |
| 2021 | $3,021 | $41,580 | $8,510 | $33,080 |
| 2020 | $2,647 | $31,990 | $6,550 | $25,450 |
| 2019 | $2,532 | $91,400 | $18,700 | $72,700 |
| 2018 | $2,406 | $31,990 | $6,550 | $25,450 |
| 2017 | $2,427 | $28,390 | $5,390 | $23,000 |
| 2016 | $2,412 | $28,390 | $5,390 | $23,000 |
| 2015 | $2,302 | $28,390 | $5,390 | $23,000 |
| 2014 | $2,302 | $28,990 | $5,500 | $23,490 |
Source: Public Records
Map
Nearby Homes
- 5231 W 16th St
- 1716 Tuxedo Ave
- 2129 North Ave
- 4884 W 13th St
- 2137 Silverdale Ave
- 4859 W 13th St
- 2302 Brookdale Ave
- 5085 W 6th St
- 5553 Sunset Ln Unit A15-F
- 5554 Landover Ct Unit 282
- 5118 W 4th St
- 1917 Alvin Ave
- 2503 Brookdale Ave
- 2446 Fortune Ave
- 4771 S Hills Dr
- 2506 Fortune Ave
- 2923 Brookview Blvd
- 2712 Ralph Ave
- 2831 Walbrook Ave
- 3000 Brookpark Rd Unit R10
- 1811 1813 Brookview Blvd
- 1811 Brookview Blvd
- 1725 Brookview Blvd
- 1725 Brookview Blvd Unit 1727
- 1815 Brookview Blvd
- 1723 Brookview Blvd
- 1819 Brookview Blvd
- 1719 Brookview Blvd
- 1808 North Ave
- 1804 North Ave
- 1812 North Ave
- 1722 North Ave
- 1823 Brookview Blvd
- 1816 North Ave
- 1715 Brookview Blvd
- 1718 North Ave
- 1827 Brookview Blvd
- 1820 North Ave
- 1714 North Ave
- 1806 Brookview Blvd