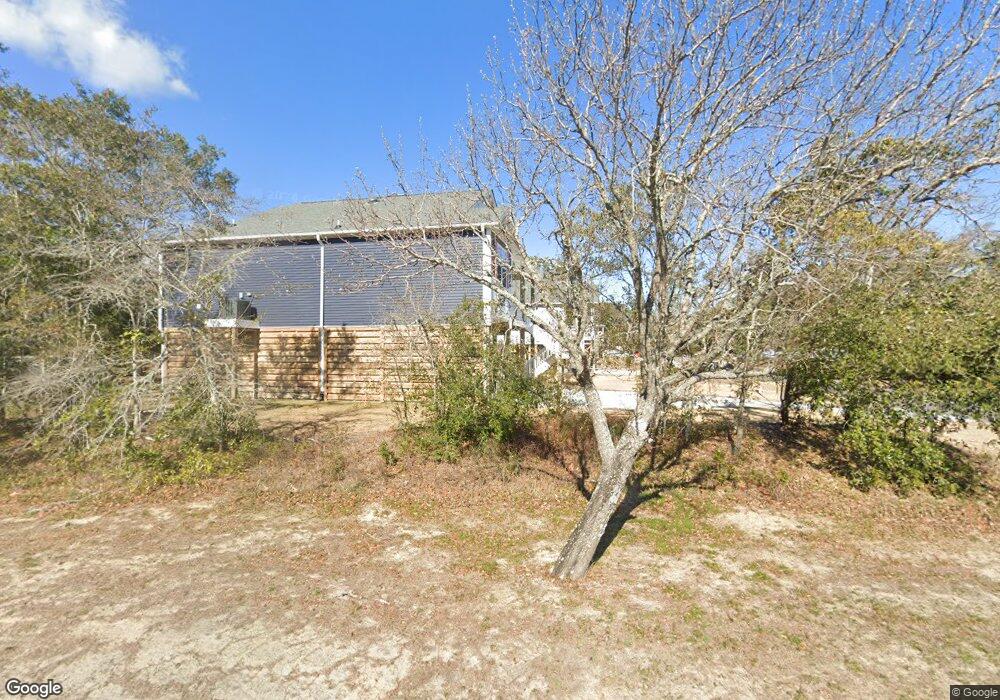
1808 E Oak Island Dr Oak Island, NC 28465
Estimated Value: $803,000 - $817,000
3
Beds
3
Baths
2,281
Sq Ft
$355/Sq Ft
Est. Value
About This Home
This home is located at 1808 E Oak Island Dr, Oak Island, NC 28465 and is currently estimated at $809,725, approximately $354 per square foot. 1808 E Oak Island Dr is a home located in Brunswick County with nearby schools including Southport Elementary School, South Brunswick Middle School, and South Brunswick High School.
Ownership History
Date
Name
Owned For
Owner Type
Purchase Details
Closed on
Jun 9, 2022
Sold by
Smith Arthur D and Smith Angela L
Bought by
Brigman Allen H
Current Estimated Value
Home Financials for this Owner
Home Financials are based on the most recent Mortgage that was taken out on this home.
Original Mortgage
$114,800
Outstanding Balance
$95,798
Interest Rate
4.31%
Mortgage Type
New Conventional
Estimated Equity
$713,927
Purchase Details
Closed on
Aug 22, 2017
Sold by
Pickler Ronnie L and Pickler Jenia F
Bought by
Smith Arthur D and Smith Angela L
Home Financials for this Owner
Home Financials are based on the most recent Mortgage that was taken out on this home.
Original Mortgage
$250,000
Interest Rate
4.03%
Mortgage Type
New Conventional
Purchase Details
Closed on
Sep 14, 2012
Sold by
Young Jay A and Young Margaret W
Bought by
Pickler Ronnie L and Pickler Jenia F
Create a Home Valuation Report for This Property
The Home Valuation Report is an in-depth analysis detailing your home's value as well as a comparison with similar homes in the area
Home Values in the Area
Average Home Value in this Area
Purchase History
| Date | Buyer | Sale Price | Title Company |
|---|---|---|---|
| Brigman Allen H | $143,500 | Johnson Ryan W | |
| Brigman Allen H | $143,500 | Johnson Ryan W | |
| Routhier Larry D | $639,000 | Johnson Ryan W | |
| Smith Arthur D | $365,000 | None Available | |
| Pickler Ronnie L | $325,000 | None Available |
Source: Public Records
Mortgage History
| Date | Status | Borrower | Loan Amount |
|---|---|---|---|
| Open | Routhier Larry D | $114,800 | |
| Closed | Routhier Larry D | $114,800 | |
| Previous Owner | Smith Arthur D | $250,000 |
Source: Public Records
Tax History Compared to Growth
Tax History
| Year | Tax Paid | Tax Assessment Tax Assessment Total Assessment is a certain percentage of the fair market value that is determined by local assessors to be the total taxable value of land and additions on the property. | Land | Improvement |
|---|---|---|---|---|
| 2025 | $2,649 | $588,840 | $125,000 | $463,840 |
| 2024 | $2,649 | $588,840 | $125,000 | $463,840 |
| 2023 | $2,466 | $588,840 | $125,000 | $463,840 |
| 2022 | $2,466 | $401,210 | $110,200 | $291,010 |
| 2021 | $2,406 | $401,210 | $110,200 | $291,010 |
| 2020 | $2,356 | $401,210 | $110,200 | $291,010 |
| 2019 | $2,356 | $125,800 | $110,200 | $15,600 |
| 2018 | $1,844 | $86,100 | $74,000 | $12,100 |
| 2017 | $1,844 | $86,100 | $74,000 | $12,100 |
| 2016 | $1,819 | $86,100 | $74,000 | $12,100 |
| 2015 | $1,819 | $327,470 | $74,000 | $253,470 |
| 2014 | $1,517 | $293,581 | $95,000 | $198,581 |
Source: Public Records
Map
Nearby Homes
- 2005 E Oak Island Dr
- 103 NE 17th St
- 109 NE 17th St
- 113 NE 21st St
- 1506 E Oak Island Dr
- 119 NE 17th St
- 120 NE 17th St
- 142 NE 17th St
- 2106 E Oak Island Dr
- 105 NE 15th St
- 124 NE 15th St
- Lot #21 NE 18th St
- Lot #20 NE 18th St
- L-5 NE 18th St
- 142 NE 18th St
- 1401 E Oak Island Dr
- 109 NE 14th St
- 135 NE 15th St
- 1304 E Oak Island Dr
- 104 SE 13th St
- 1806 E Oak Island Dr
- 1804 E Oak Island Dr
- 97 NE Ne 19th St
- 101 NE Ne 19th St
- 99 NE 19th St
- 101 NE 19th St
- 101 NE 19th St Unit A
- 101 NE 19th St Unit A
- 101 NE 19th St Unit B
- 1802 E Oak Island Dr
- 1902 E Oak Island Dr
- 103 NW 19th St
- 103 NE 19th St
- 98 NE 18th St
- 102 NE 18th St
- 102 NE 19th St
- 1904 E Oak Island Dr
- 104 NE 18th St
- 105 NE 19th St
- 106 NE 18th St