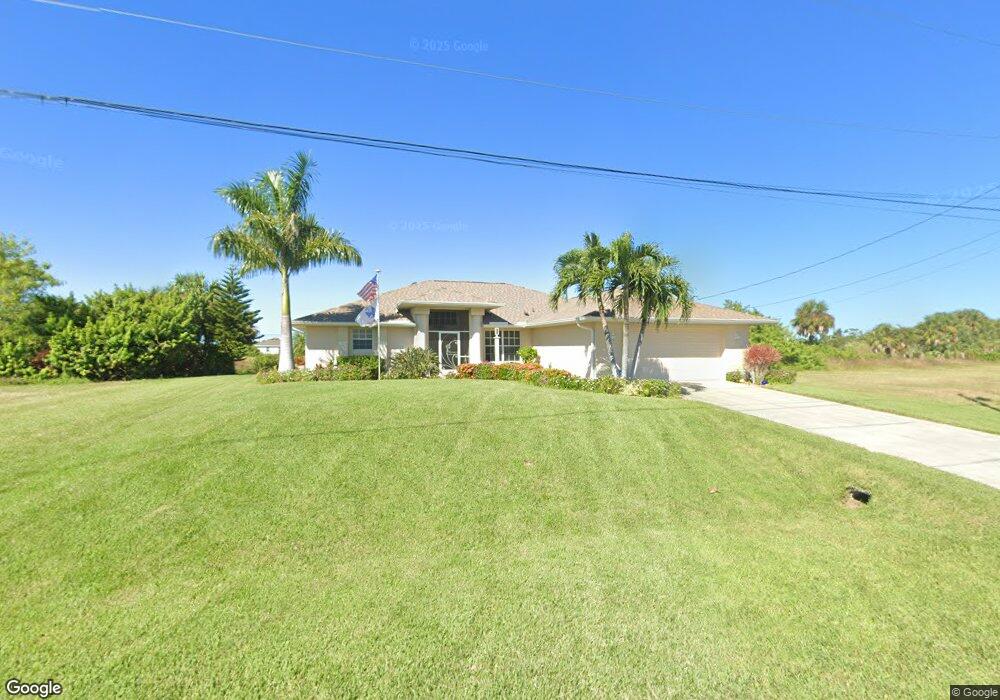
1808 NW 30th Place Cape Coral, FL 33993
Burnt Store NeighborhoodEstimated Value: $349,098 - $606,000
4
Beds
3
Baths
2,479
Sq Ft
$190/Sq Ft
Est. Value
About This Home
This home is located at 1808 NW 30th Place, Cape Coral, FL 33993 and is currently estimated at $471,525, approximately $190 per square foot. 1808 NW 30th Place is a home located in Lee County with nearby schools including Dr. Carrie D. Robinson Littleton Elementary School, Caloosa Elementary School, and Tropic Isles Elementary School.
Ownership History
Date
Name
Owned For
Owner Type
Purchase Details
Closed on
Sep 14, 2012
Sold by
Ricks Gilbert and Ricks Evelyn E
Bought by
Street James M and Street Joan Ella
Current Estimated Value
Purchase Details
Closed on
Feb 13, 2009
Sold by
Federal Trust Bank
Bought by
Ricks Gilbert and Ricks Evelyn E
Purchase Details
Closed on
Dec 30, 2008
Sold by
Martin James M
Bought by
Federal Trust Bank and Transland Financial Services Inc
Purchase Details
Closed on
Oct 4, 2005
Sold by
Jacobson Eric and Jacobson Rita
Bought by
Martin James
Home Financials for this Owner
Home Financials are based on the most recent Mortgage that was taken out on this home.
Original Mortgage
$401,400
Interest Rate
6.04%
Mortgage Type
Construction
Purchase Details
Closed on
Jan 8, 2004
Sold by
Ench Kiley Edgar and Ench Kiley Joan
Bought by
Jacobson Eric and Jacobson Rita J
Create a Home Valuation Report for This Property
The Home Valuation Report is an in-depth analysis detailing your home's value as well as a comparison with similar homes in the area
Home Values in the Area
Average Home Value in this Area
Purchase History
| Date | Buyer | Sale Price | Title Company |
|---|---|---|---|
| Street James M | $192,500 | American Title Insurance Co | |
| Ricks Gilbert | $140,100 | Title Junction Llc | |
| Federal Trust Bank | -- | None Available | |
| Martin James | $149,900 | Lawyers Advantage Title Grou | |
| Jacobson Eric | $48,000 | -- |
Source: Public Records
Mortgage History
| Date | Status | Borrower | Loan Amount |
|---|---|---|---|
| Previous Owner | Martin James | $401,400 |
Source: Public Records
Tax History Compared to Growth
Tax History
| Year | Tax Paid | Tax Assessment Tax Assessment Total Assessment is a certain percentage of the fair market value that is determined by local assessors to be the total taxable value of land and additions on the property. | Land | Improvement |
|---|---|---|---|---|
| 2025 | $3,096 | $190,851 | -- | -- |
| 2024 | $2,957 | $185,472 | -- | -- |
| 2023 | $2,957 | $175,070 | $0 | $0 |
| 2022 | $2,729 | $174,825 | $0 | $0 |
| 2021 | $2,749 | $214,073 | $14,000 | $200,073 |
| 2020 | $2,772 | $167,390 | $0 | $0 |
| 2019 | $2,681 | $163,627 | $0 | $0 |
| 2018 | $2,666 | $160,576 | $0 | $0 |
| 2017 | $2,646 | $157,273 | $0 | $0 |
| 2016 | $2,574 | $170,165 | $14,000 | $156,165 |
| 2015 | $2,581 | $170,097 | $14,000 | $156,097 |
| 2014 | -- | $169,787 | $12,500 | $157,287 |
| 2013 | -- | $149,510 | $11,100 | $138,410 |
Source: Public Records
Map
Nearby Homes
- 1816 NW 30th Place
- 1812 NW 30th Place
- 2922 NW 19th St
- 2928 NW 18th Terrace
- 2908 NW 19th St
- 1826 NW 31st Place
- 1806 NW 31st Place
- 2909 NW 19th Terrace
- 2933 Van Buren Pkwy
- 1821 NW 29th Ave
- 3101 NW 17th Ln
- 100 Burnt Store Rd
- 1908 NW 28th Place
- 3123 NW 17 Ln
- 3123 NW 17th Ln
- 1813 NW 32nd Place
- 1823 NW 28th Place
- 1903 NW 28th Place
- 3208 NW 20th St
- 2815 Van Buren Pkwy
- 1816 NW 30th Place Unit 33
- 2934 NW 19th St
- 1811 NW 31st Ave
- 1815 NW 31st Ave
- 1800 NW 30th Place
- 1807 NW 31st Ave
- 1819 NW 31st Ave Unit 23+24
- 1819 NW 31st Ave
- 2930 NW 19th St Unit 57
- 2931 NW 18th Terrace
- 1803 NW 31st Ave
- 2935 NW 19th St
- 1825 NW 31st Ave
- 1906 NW 30th Place Unit 29
- 2926 NW 19th St
- 1801 NW 31st Ave
- 2925 NW 18th Terrace
- 1810 NW 31st Place
- 1810 NW 31st Ave
- 2932 NW 18th Terrace