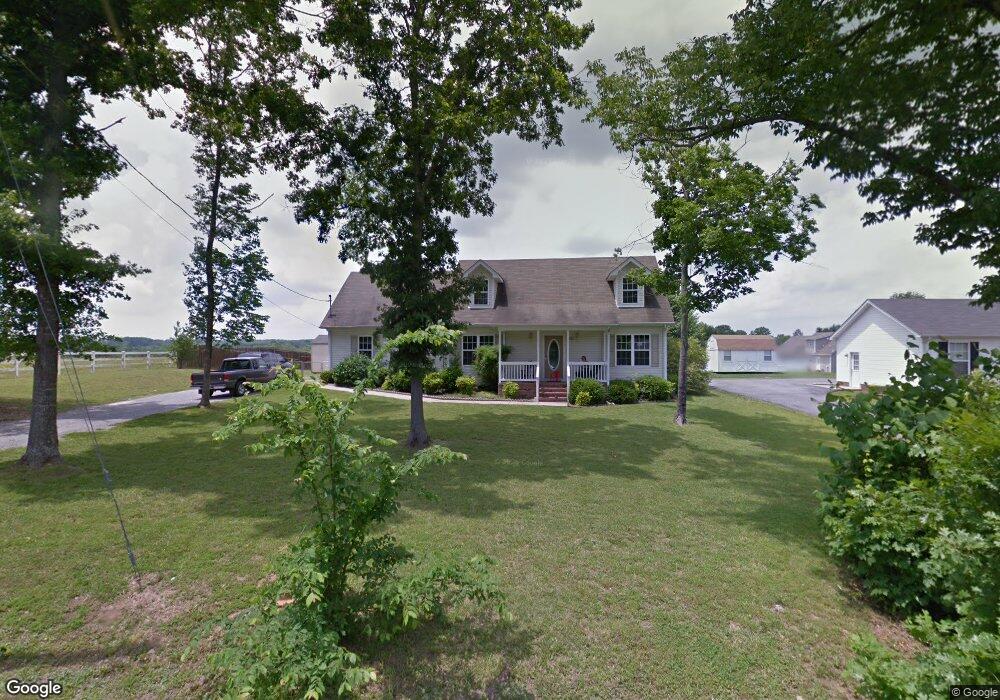
1808 Valley Rd Shelbyville, TN 37160
Estimated Value: $327,000 - $363,000
--
Bed
2
Baths
1,698
Sq Ft
$200/Sq Ft
Est. Value
About This Home
This home is located at 1808 Valley Rd, Shelbyville, TN 37160 and is currently estimated at $339,528, approximately $199 per square foot. 1808 Valley Rd is a home located in Bedford County with nearby schools including South Side Elementary School, Harris Middle School, and Shelbyville Central High School.
Ownership History
Date
Name
Owned For
Owner Type
Purchase Details
Closed on
Apr 15, 2013
Sold by
Federal National Mortgage Association
Bought by
Pruitt Chasity
Current Estimated Value
Home Financials for this Owner
Home Financials are based on the most recent Mortgage that was taken out on this home.
Original Mortgage
$105,945
Outstanding Balance
$75,134
Interest Rate
3.65%
Mortgage Type
FHA
Estimated Equity
$264,394
Purchase Details
Closed on
Nov 15, 2012
Sold by
Mallett David R
Bought by
Federal National Mtg Associati
Purchase Details
Closed on
Jan 12, 2005
Sold by
American Value Homes Inc
Bought by
Mallett David R
Home Financials for this Owner
Home Financials are based on the most recent Mortgage that was taken out on this home.
Original Mortgage
$119,850
Interest Rate
5.61%
Purchase Details
Closed on
Jan 6, 2005
Sold by
American Value Homes Llc
Bought by
Mallett David R
Home Financials for this Owner
Home Financials are based on the most recent Mortgage that was taken out on this home.
Original Mortgage
$119,850
Interest Rate
5.61%
Create a Home Valuation Report for This Property
The Home Valuation Report is an in-depth analysis detailing your home's value as well as a comparison with similar homes in the area
Home Values in the Area
Average Home Value in this Area
Purchase History
| Date | Buyer | Sale Price | Title Company |
|---|---|---|---|
| Pruitt Chasity | $107,900 | -- | |
| Federal National Mtg Associati | $119,806 | -- | |
| Mallett David R | $141,000 | -- | |
| Mallett David R | $141,000 | -- |
Source: Public Records
Mortgage History
| Date | Status | Borrower | Loan Amount |
|---|---|---|---|
| Open | Pruitt Chasity | $105,945 | |
| Previous Owner | Mallett David R | $119,850 |
Source: Public Records
Tax History Compared to Growth
Tax History
| Year | Tax Paid | Tax Assessment Tax Assessment Total Assessment is a certain percentage of the fair market value that is determined by local assessors to be the total taxable value of land and additions on the property. | Land | Improvement |
|---|---|---|---|---|
| 2025 | -- | $50,525 | $0 | $0 |
| 2024 | -- | $50,525 | $9,500 | $41,025 |
| 2023 | $1,923 | $50,525 | $9,500 | $41,025 |
| 2022 | $1,978 | $50,525 | $9,500 | $41,025 |
| 2021 | $1,796 | $50,525 | $9,500 | $41,025 |
| 2020 | $1,449 | $50,525 | $9,500 | $41,025 |
| 2019 | $1,449 | $32,725 | $4,250 | $28,475 |
| 2018 | $1,417 | $32,725 | $4,250 | $28,475 |
| 2017 | $1,417 | $32,725 | $4,250 | $28,475 |
| 2016 | $1,404 | $32,725 | $4,250 | $28,475 |
| 2015 | $1,404 | $32,725 | $4,250 | $28,475 |
| 2014 | $1,157 | $29,505 | $0 | $0 |
Source: Public Records
Map
Nearby Homes
- 602 Narrows Rd
- 300 Scenic Dr
- 1605 S Cannon Blvd Unit 201
- 823 Brookhaven Cir
- 103 Davis St
- 315 Woodland Dr
- 0 Hilltop Dr
- 439 Tines Dr
- 102 Doak St
- 127 Doak St
- 125 Burrum Dr
- 128 Riverlake Rd
- 222 Carter St
- 702 Adams Dr
- 110 Stonebrook Dr
- 107 Stonebrook Dr
- 116 Stonebrook Dr
- 112 Stonebrook Dr
- 508 Lewis Ave
- 600 Lewis Ave