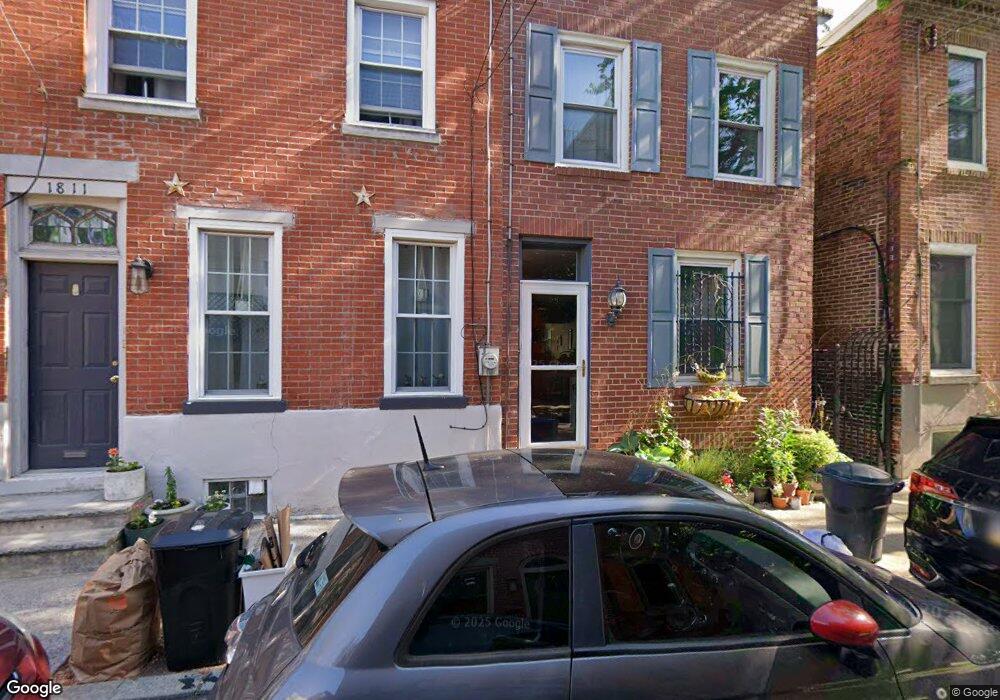
1809 Pemberton St Philadelphia, PA 19146
Southwest Center City NeighborhoodEstimated Value: $563,000 - $751,000
--
Bed
--
Bath
1,497
Sq Ft
$426/Sq Ft
Est. Value
About This Home
This home is located at 1809 Pemberton St, Philadelphia, PA 19146 and is currently estimated at $637,613, approximately $425 per square foot. 1809 Pemberton St is a home located in Philadelphia County with nearby schools including Edwin M. Stanton School, South Philadelphia High School, and Independence Charter School.
Ownership History
Date
Name
Owned For
Owner Type
Purchase Details
Closed on
Dec 7, 2004
Sold by
Barber Oliver and Ward Megan
Bought by
Kabat Carl B and Chin Karen
Current Estimated Value
Home Financials for this Owner
Home Financials are based on the most recent Mortgage that was taken out on this home.
Original Mortgage
$278,800
Outstanding Balance
$139,716
Interest Rate
5.74%
Mortgage Type
Purchase Money Mortgage
Estimated Equity
$497,897
Purchase Details
Closed on
Apr 19, 2001
Sold by
Ashley Elizabeth A
Bought by
Ward Megan and Barber Oliver
Home Financials for this Owner
Home Financials are based on the most recent Mortgage that was taken out on this home.
Original Mortgage
$151,200
Interest Rate
6.88%
Purchase Details
Closed on
Mar 31, 1999
Sold by
Jain Ashish M
Bought by
Ashley Elizabeth A
Purchase Details
Closed on
Jul 13, 1996
Sold by
Cooke Barbara
Bought by
Jain Ashish M
Purchase Details
Closed on
Apr 23, 1995
Sold by
Cooke Gregg
Bought by
Cooke Barbara
Create a Home Valuation Report for This Property
The Home Valuation Report is an in-depth analysis detailing your home's value as well as a comparison with similar homes in the area
Home Values in the Area
Average Home Value in this Area
Purchase History
| Date | Buyer | Sale Price | Title Company |
|---|---|---|---|
| Kabat Carl B | $348,500 | Commonwealth Title | |
| Ward Megan | $189,000 | -- | |
| Ashley Elizabeth A | $89,300 | -- | |
| Jain Ashish M | $55,000 | -- | |
| Cooke Barbara | -- | -- |
Source: Public Records
Mortgage History
| Date | Status | Borrower | Loan Amount |
|---|---|---|---|
| Open | Kabat Carl B | $278,800 | |
| Previous Owner | Ward Megan | $151,200 | |
| Closed | Kabat Carl B | $34,850 |
Source: Public Records
Tax History Compared to Growth
Tax History
| Year | Tax Paid | Tax Assessment Tax Assessment Total Assessment is a certain percentage of the fair market value that is determined by local assessors to be the total taxable value of land and additions on the property. | Land | Improvement |
|---|---|---|---|---|
| 2025 | $8,465 | $571,700 | $114,340 | $457,360 |
| 2024 | $8,465 | $571,700 | $114,340 | $457,360 |
| 2023 | $8,465 | $604,700 | $120,900 | $483,800 |
| 2022 | $4,827 | $559,700 | $120,900 | $438,800 |
| 2021 | $5,456 | $0 | $0 | $0 |
| 2020 | $5,456 | $0 | $0 | $0 |
| 2019 | $5,584 | $0 | $0 | $0 |
| 2018 | $5,029 | $0 | $0 | $0 |
| 2017 | $5,029 | $0 | $0 | $0 |
| 2016 | $984 | $0 | $0 | $0 |
| 2015 | $6,226 | $0 | $0 | $0 |
| 2014 | -- | $494,600 | $50,089 | $444,511 |
| 2012 | -- | $25,760 | $6,440 | $19,320 |
Source: Public Records
Map
Nearby Homes
- 1811 Fitzwater St Unit E
- 719 S 19th St
- 725 S 19th St
- 1727 Fitzwater St Unit B
- 761 S Cleveland St
- 1723 Fitzwater St Unit B
- 726 S 19th St
- 1815 Bainbridge St Unit 1
- 1815 00 Bainbridge St Unit 2
- 1731 Bainbridge St
- 805 S 19th St
- 768 S Martin St
- 722 S 17th St Unit 7
- 1800 Webster St
- 710 S 17th St
- 1821 Christian St
- 1809 Christian St
- 705-07 S 20th St Unit A
- 701 S 17th St
- 1924 South St
- 1811 Pemberton St
- 1807 Pemberton St
- 1813 Pemberton St
- 1815 Pemberton St
- 710 S 18th St
- 714 S 18th St
- 716 S 18th St
- 708 S 18th St
- 712 S 18th St
- 1817 Pemberton St
- 1808 Pemberton St
- 706 S 18th St
- 706 S 18th St Unit 2 (2ND FLOOR)
- 1806 Pemberton St
- 1819 Pemberton St
- 1810 Pemberton St
- 1804 Bainbridge St
- 1806 Bainbridge St
- 718 S 18th St
- 704 S 18th St