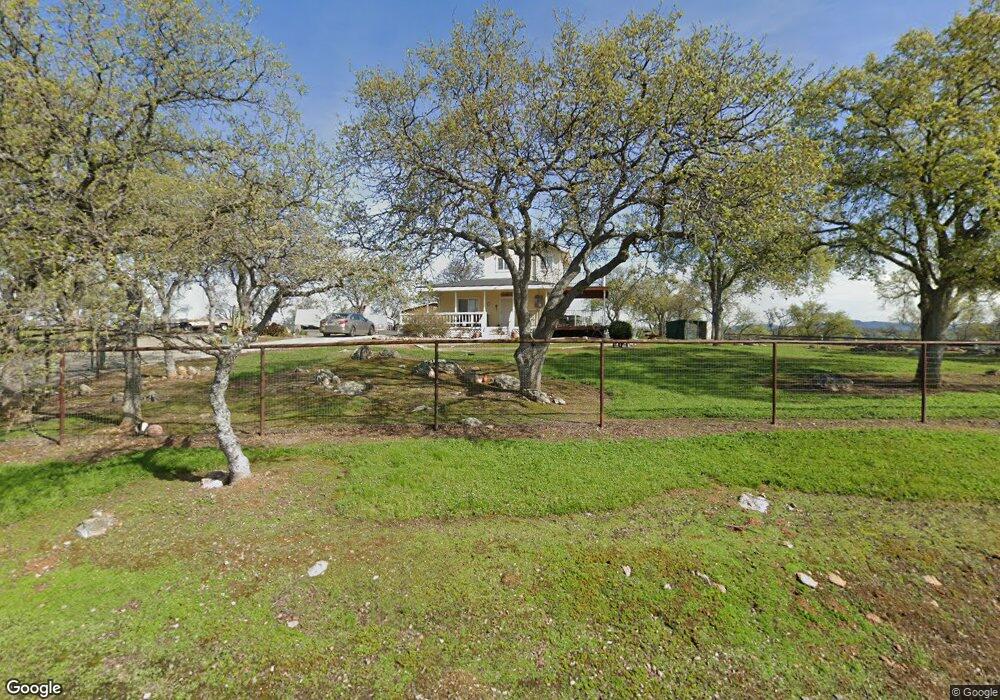
1810 Buena Vista Dr La Grange, CA 95329
Estimated Value: $316,215 - $387,000
3
Beds
2
Baths
1,242
Sq Ft
$277/Sq Ft
Est. Value
About This Home
This home is located at 1810 Buena Vista Dr, La Grange, CA 95329 and is currently estimated at $344,554, approximately $277 per square foot. 1810 Buena Vista Dr is a home located in Tuolumne County.
Ownership History
Date
Name
Owned For
Owner Type
Purchase Details
Closed on
Feb 25, 2010
Sold by
Federal National Mortgage Association
Bought by
Blagg Bret and Blagg Shannell
Current Estimated Value
Home Financials for this Owner
Home Financials are based on the most recent Mortgage that was taken out on this home.
Original Mortgage
$152,290
Outstanding Balance
$100,733
Interest Rate
4.94%
Mortgage Type
New Conventional
Estimated Equity
$243,821
Purchase Details
Closed on
Oct 30, 2009
Sold by
Markes William
Bought by
Fannie Mae
Purchase Details
Closed on
Mar 1, 2005
Sold by
Markes Sandra A
Bought by
Markes William
Home Financials for this Owner
Home Financials are based on the most recent Mortgage that was taken out on this home.
Original Mortgage
$260,000
Interest Rate
4.7%
Mortgage Type
Unknown
Create a Home Valuation Report for This Property
The Home Valuation Report is an in-depth analysis detailing your home's value as well as a comparison with similar homes in the area
Home Values in the Area
Average Home Value in this Area
Purchase History
| Date | Buyer | Sale Price | Title Company |
|---|---|---|---|
| Blagg Bret | $157,000 | Placer Title Company | |
| Fannie Mae | $350,225 | None Available | |
| Markes William | -- | Yosemite Title Co | |
| Markes William | $325,000 | Yosemite Title Co |
Source: Public Records
Mortgage History
| Date | Status | Borrower | Loan Amount |
|---|---|---|---|
| Open | Blagg Bret | $152,290 | |
| Previous Owner | Markes William | $260,000 | |
| Closed | Markes William | $65,000 |
Source: Public Records
Tax History Compared to Growth
Tax History
| Year | Tax Paid | Tax Assessment Tax Assessment Total Assessment is a certain percentage of the fair market value that is determined by local assessors to be the total taxable value of land and additions on the property. | Land | Improvement |
|---|---|---|---|---|
| 2025 | $2,388 | $229,277 | $77,441 | $151,836 |
| 2024 | $2,388 | $224,782 | $75,923 | $148,859 |
| 2023 | $2,334 | $220,376 | $74,435 | $145,941 |
| 2022 | $2,287 | $216,056 | $72,976 | $143,080 |
| 2021 | $2,252 | $211,821 | $71,546 | $140,275 |
| 2020 | $2,214 | $209,650 | $70,813 | $138,837 |
| 2019 | $2,145 | $205,540 | $69,425 | $136,115 |
| 2018 | $2,093 | $201,511 | $68,064 | $133,447 |
| 2017 | $2,065 | $197,561 | $66,730 | $130,831 |
| 2016 | $1,767 | $171,188 | $65,422 | $105,766 |
| 2015 | $1,744 | $168,618 | $64,440 | $104,178 |
| 2014 | $1,702 | $165,316 | $63,178 | $102,138 |
Source: Public Records
Map
Nearby Homes
- 14377 Avenida Central
- 14430 Avenida Central
- 2211 Buena Vista Dr
- 0 Buena Vista Dr Unit 223109418
- 1668 Carmelita Ln
- 2155 El Faro Way
- 1746 Las Flores Ct
- 9713 Rastro Way
- 0 Soledad Way N
- 2162 Zarzamora St
- 9668 Laredo St
- 9777 Rastro Way
- 2847 Zarzamora St
- 9185 Banderilla Dr
- 1400 Medina Ct
- 14778 Navarro Ct
- 0 Navarro Ct Unit 222146050
- 2251 Pepito Dr
- 9701 Dolorosa St
- 9570 Banderilla Dr
- 1838 Buena Vista Dr
- 14270 Avenida Central
- 1900 Buena Vista Dr Unit 2
- 14265 Avenida Central
- 14309 Avenida Central
- 9814 Buena Vista Dr
- 14350 Avenida Central
- 1952 Buena Vista Dr
- 1821 Carmelita Ln
- 2T-178 Avenida Central
- 185 Avenida Central
- 178 Avenida Central
- 15076 Avenida Central
- 396 Avenida Central
- 207 Avenida Central
- 745 Avenida Central
- 2T-178 Avenida Central Unit 2T/178
- 0 Avenida Central
- 14343 Avenida Central
- 1775 Buena Vista Dr