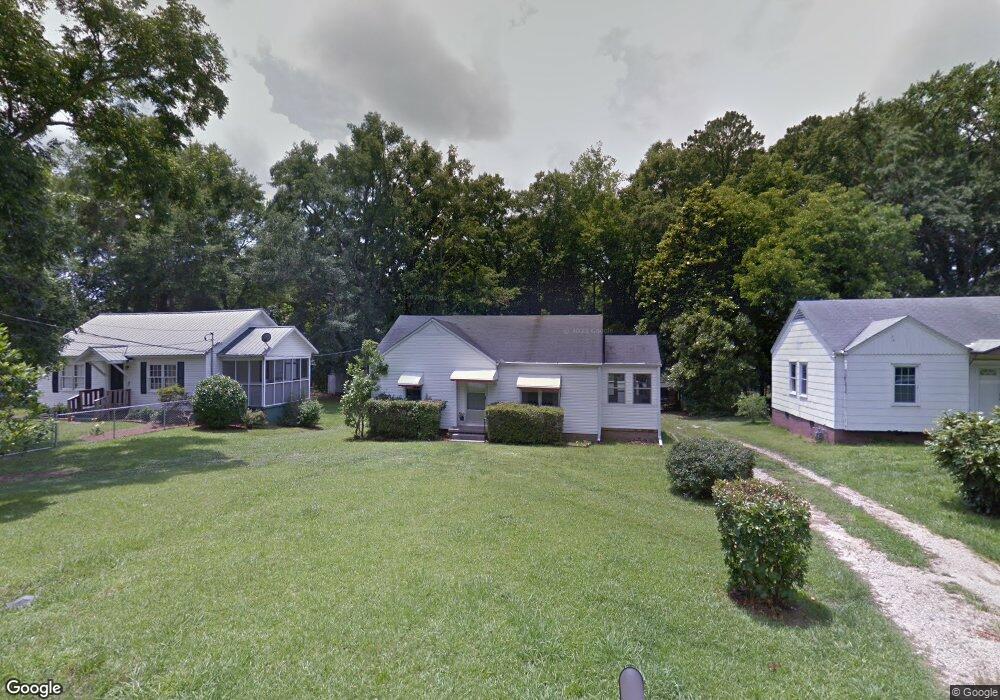
1810 Park Dr Greenville, GA 30222
Estimated Value: $74,000 - $93,000
--
Bed
1
Bath
733
Sq Ft
$110/Sq Ft
Est. Value
About This Home
This home is located at 1810 Park Dr, Greenville, GA 30222 and is currently estimated at $80,511, approximately $109 per square foot. 1810 Park Dr is a home located in Meriwether County with nearby schools including George E. Washington Elementary School.
Ownership History
Date
Name
Owned For
Owner Type
Purchase Details
Closed on
Sep 11, 2025
Sold by
Rosen Billie
Bought by
Ginn Roberson Ashley and Ginn Charles Roberson
Current Estimated Value
Purchase Details
Closed on
May 15, 2020
Sold by
Andersen Adam A
Bought by
Andersen Jeffrey G
Purchase Details
Closed on
Sep 20, 2018
Sold by
Degler Gary N
Bought by
Andersen Adam A
Purchase Details
Closed on
Jun 13, 2018
Sold by
Massengale Kennedy Joanne
Bought by
Degler Gary N and Degler Angela G
Home Financials for this Owner
Home Financials are based on the most recent Mortgage that was taken out on this home.
Original Mortgage
$20,000
Interest Rate
4.6%
Mortgage Type
Purchase Money Mortgage
Purchase Details
Closed on
Oct 29, 2002
Sold by
Todd Robert Lee
Bought by
Kennedy Joanne Massengale
Purchase Details
Closed on
Jan 1, 1988
Bought by
Kennedy Joanne Masse
Create a Home Valuation Report for This Property
The Home Valuation Report is an in-depth analysis detailing your home's value as well as a comparison with similar homes in the area
Home Values in the Area
Average Home Value in this Area
Purchase History
| Date | Buyer | Sale Price | Title Company |
|---|---|---|---|
| Ginn Roberson Ashley | $31,900 | -- | |
| Andersen Jeffrey G | -- | -- | |
| Andersen Adam A | $36,000 | -- | |
| Degler Gary N | $20,000 | -- | |
| Kennedy Joanne Massengale | $300 | -- | |
| Kennedy Joanne Masse | -- | -- |
Source: Public Records
Mortgage History
| Date | Status | Borrower | Loan Amount |
|---|---|---|---|
| Previous Owner | Degler Gary N | $20,000 |
Source: Public Records
Tax History Compared to Growth
Tax History
| Year | Tax Paid | Tax Assessment Tax Assessment Total Assessment is a certain percentage of the fair market value that is determined by local assessors to be the total taxable value of land and additions on the property. | Land | Improvement |
|---|---|---|---|---|
| 2024 | $647 | $13,312 | $1,640 | $11,672 |
| 2023 | $668 | $13,312 | $1,640 | $11,672 |
| 2022 | $459 | $13,312 | $1,640 | $11,672 |
| 2021 | $467 | $13,312 | $1,640 | $11,672 |
| 2020 | $470 | $13,312 | $1,640 | $11,672 |
| 2019 | $472 | $13,312 | $1,640 | $11,672 |
| 2018 | $413 | $11,552 | $1,640 | $9,912 |
| 2017 | $418 | $11,552 | $1,640 | $9,912 |
| 2016 | $376 | $11,432 | $1,520 | $9,912 |
| 2015 | $377 | $11,432 | $1,520 | $9,912 |
| 2014 | $377 | $11,432 | $1,520 | $9,912 |
| 2013 | -- | $11,432 | $1,520 | $9,912 |
Source: Public Records
Map
Nearby Homes
- 421 Lagrange St
- 934 R D Hill St
- 568 S Talbotton St
- 35+/- AC Georgia 109
- 570 Gay Connector Rd
- 18760 Roosevelt Hwy
- 1152 Old Durand Rd
- 77 Perdue Rd
- 909 Threadgill Rd
- 75 Lee Ln
- 854 Lee Ln
- 2638 Jarrell Rd
- 2001 Threadgill Rd
- 2067 Threadgill Rd
- 2717 Mount Pilgrim Rd
- 4444 Lagrange Hwy
- 3860 Cedar Rock Rd
- 0 Owens Rd Unit 219685
- 2114 Allie Rd
- 5582 Georgia 100