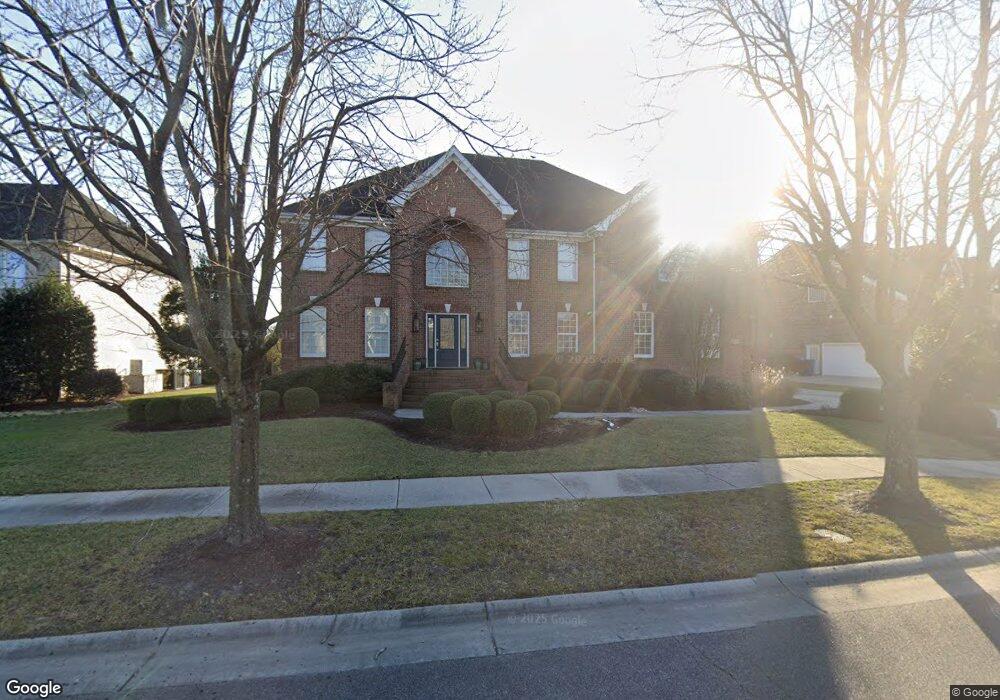
1813 Fury Way Virginia Beach, VA 23456
Virginia Beach Central NeighborhoodEstimated Value: $999,000 - $1,170,491
6
Beds
4
Baths
4,668
Sq Ft
$237/Sq Ft
Est. Value
About This Home
This home is located at 1813 Fury Way, Virginia Beach, VA 23456 and is currently estimated at $1,107,873, approximately $237 per square foot. 1813 Fury Way is a home located in Virginia Beach City with nearby schools including Three Oaks Elementary School, Princess Anne Middle School, and Floyd E. Kellam High School.
Ownership History
Date
Name
Owned For
Owner Type
Purchase Details
Closed on
Nov 12, 2010
Sold by
Navy Federal Credit Union
Bought by
Keenan Construction Llc
Current Estimated Value
Purchase Details
Closed on
Jun 6, 2007
Sold by
Kopassis Dev Corp
Bought by
Keenan James D
Home Financials for this Owner
Home Financials are based on the most recent Mortgage that was taken out on this home.
Original Mortgage
$584,700
Interest Rate
6.17%
Mortgage Type
New Conventional
Create a Home Valuation Report for This Property
The Home Valuation Report is an in-depth analysis detailing your home's value as well as a comparison with similar homes in the area
Home Values in the Area
Average Home Value in this Area
Purchase History
| Date | Buyer | Sale Price | Title Company |
|---|---|---|---|
| Keenan Construction Llc | $167,900 | -- | |
| Keenan James D | $779,600 | -- |
Source: Public Records
Mortgage History
| Date | Status | Borrower | Loan Amount |
|---|---|---|---|
| Previous Owner | Keenan James D | $584,700 |
Source: Public Records
Tax History Compared to Growth
Tax History
| Year | Tax Paid | Tax Assessment Tax Assessment Total Assessment is a certain percentage of the fair market value that is determined by local assessors to be the total taxable value of land and additions on the property. | Land | Improvement |
|---|---|---|---|---|
| 2025 | $9,666 | $1,009,200 | $290,000 | $719,200 |
| 2024 | $9,666 | $996,500 | $290,000 | $706,500 |
| 2023 | $8,643 | $873,000 | $240,000 | $633,000 |
| 2022 | $7,856 | $793,500 | $210,000 | $583,500 |
| 2021 | $7,253 | $732,600 | $190,000 | $542,600 |
| 2020 | $6,731 | $661,500 | $170,000 | $491,500 |
| 2019 | $6,883 | $637,400 | $177,000 | $460,400 |
| 2018 | $6,390 | $637,400 | $177,000 | $460,400 |
| 2017 | $6,390 | $637,400 | $177,000 | $460,400 |
| 2016 | $6,190 | $625,300 | $170,000 | $455,300 |
| 2015 | $6,266 | $632,900 | $177,600 | $455,300 |
| 2014 | $5,823 | $632,300 | $177,600 | $454,700 |
Source: Public Records
Map
Nearby Homes
- 2893 Weston Loop
- 2889 Weston Loop
- 2885 Weston Loop
- 2884 Weston Loop
- 2881 Weston Loop
- 2877 Weston Loop
- 2873 Weston Loop
- 2869 Weston Loop
- 2812 Alford St
- 2809 Alford St
- 2813 Alford St
- 1836 Malvern Dr
- 1781 Champion Cir
- 1845 Malvern Dr
- 2856 Weston Loop
- 2852 Weston Loop
- 2952 Weston Loop
- 2629 Level Loop Rd
- 2960 Weston Loop
- 1645 Flanagans Ln