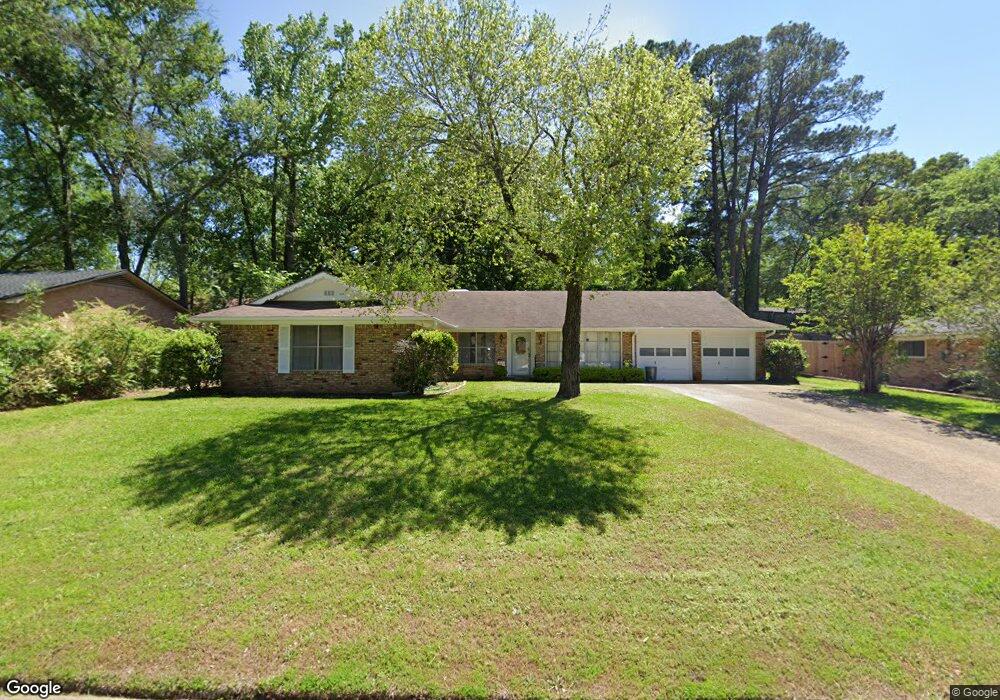
1817 1817 Sybil Tyler, TX 75703
Green Acres NeighborhoodEstimated Value: $280,593 - $297,000
--
Bed
2
Baths
2,105
Sq Ft
$138/Sq Ft
Est. Value
About This Home
This home is located at 1817 1817 Sybil, Tyler, TX 75703 and is currently estimated at $289,898, approximately $137 per square foot. 1817 1817 Sybil is a home located in Smith County with nearby schools including Woods Elementary School, Hubbard Middle School, and Tyler Legacy High School.
Ownership History
Date
Name
Owned For
Owner Type
Purchase Details
Closed on
Sep 25, 2015
Sold by
Peterson Gloria Jean
Bought by
Kavanaugh Jonathan Patrick and Kavanaugh Diane Raby
Current Estimated Value
Home Financials for this Owner
Home Financials are based on the most recent Mortgage that was taken out on this home.
Original Mortgage
$134,725
Outstanding Balance
$80,057
Interest Rate
3.99%
Mortgage Type
New Conventional
Estimated Equity
$209,841
Purchase Details
Closed on
Mar 13, 2006
Sold by
Peterson Gloria Jean Hendricks
Bought by
Hendricks Esther Rosamond
Purchase Details
Closed on
Aug 1, 2005
Sold by
Peterson Gloria Jean Hendricks
Bought by
Peterson Gloria Jean Hendricks and The Hendricks Family Trust
Create a Home Valuation Report for This Property
The Home Valuation Report is an in-depth analysis detailing your home's value as well as a comparison with similar homes in the area
Home Values in the Area
Average Home Value in this Area
Purchase History
| Date | Buyer | Sale Price | Title Company |
|---|---|---|---|
| Kavanaugh Jonathan Patrick | -- | Landmark Title Inc | |
| Hendricks Esther Rosamond | -- | None Available | |
| Peterson Gloria Jean Hendricks | -- | None Available | |
| Peterson Gloria Jean Hendricks | -- | None Available |
Source: Public Records
Mortgage History
| Date | Status | Borrower | Loan Amount |
|---|---|---|---|
| Open | Kavanaugh Jonathan Patrick | $134,725 |
Source: Public Records
Tax History Compared to Growth
Tax History
| Year | Tax Paid | Tax Assessment Tax Assessment Total Assessment is a certain percentage of the fair market value that is determined by local assessors to be the total taxable value of land and additions on the property. | Land | Improvement |
|---|---|---|---|---|
| 2025 | $2,994 | $303,210 | $58,696 | $244,514 |
| 2024 | $2,994 | $233,619 | $30,192 | $263,846 |
| 2023 | $3,702 | $282,742 | $30,192 | $252,550 |
| 2022 | $3,783 | $242,985 | $27,744 | $215,241 |
| 2021 | $3,682 | $175,522 | $27,744 | $147,778 |
| 2020 | $3,656 | $170,833 | $26,112 | $144,721 |
| 2019 | $3,605 | $164,881 | $16,320 | $148,561 |
| 2018 | $3,443 | $158,301 | $16,320 | $141,981 |
| 2017 | $3,380 | $158,301 | $16,320 | $141,981 |
| 2016 | $3,084 | $144,459 | $16,320 | $128,139 |
| 2015 | $690 | $139,049 | $16,320 | $122,729 |
| 2014 | $690 | $141,514 | $16,320 | $125,194 |
Source: Public Records
Map
Nearby Homes
- 1720 Kimwood Ln
- 1807 Kimwood Ln
- 4211 Birdwell Dr
- 1608 Yosemite Dr
- 2007 Villa Dr
- 2006 Villa Dr
- 2108 Aberdeen Dr
- 4314 Aberdeen Dr
- 1809 Chipco Dr
- 1505 Glenrose St
- 1818 Kensington Dr
- 4505 Inverness Dr
- 3400 Birdwell Dr
- 1107 Pinedale Place
- 1507 Kensington Dr
- 1705 Devonshire Dr
- 3523 S Cameron Ave
- 2106 Kensington Dr
- 1408 Westfield St
- 1811 Picadilly Place
- 1817 Sybil Ln
- 1827 1827 Sybil
- 1827 Sybil Ln
- 1809 Sybil Ln
- 1818 Kimwood Ln
- 1824 Kimwood Ln
- 1812 1812 Kimwood Ln
- 1812 1812 Kimwood
- 1801 1801 Sybil
- 1801 Sybil Ln
- 1816 Sybil Ln
- 1806 Kimwood Ln
- 1808 Sybil Ln
- 1800 1800 Sybil Ln
- 1721 Sybil Ln
- 1721 1721 Sybil
- 4201 4201 Park Place
- 4201 Park Place
- 1800 Sybil Ln
- 4205 Park Place