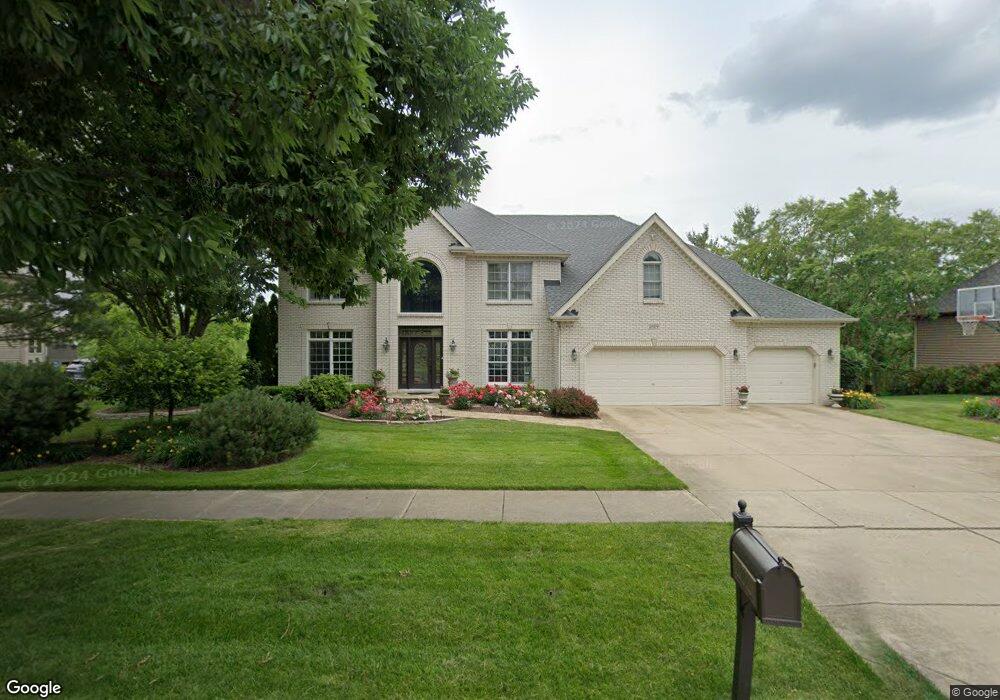
1819 Baybrook Ct Naperville, IL 60564
River Run NeighborhoodEstimated Value: $846,000 - $991,000
4
Beds
4
Baths
3,305
Sq Ft
$278/Sq Ft
Est. Value
About This Home
This home is located at 1819 Baybrook Ct, Naperville, IL 60564 and is currently estimated at $918,037, approximately $277 per square foot. 1819 Baybrook Ct is a home located in Will County with nearby schools including Graham Elementary School, Ellsworth Elementary School, and Clifford Crone Middle School.
Ownership History
Date
Name
Owned For
Owner Type
Purchase Details
Closed on
May 17, 2023
Sold by
Leshock John C and Leshock Susan
Bought by
Leshock Family Declaration Of Trust and Leshock
Current Estimated Value
Purchase Details
Closed on
Sep 9, 2006
Sold by
Benedetto Bruce R and Benedetto Suzanne M
Bought by
Leshock John C and Leshock Susan
Home Financials for this Owner
Home Financials are based on the most recent Mortgage that was taken out on this home.
Original Mortgage
$636,000
Interest Rate
6.49%
Mortgage Type
Purchase Money Mortgage
Purchase Details
Closed on
Jul 24, 1998
Sold by
Kobler Builders Inc
Bought by
Benedetto Bruce R and Benedetto Suzanne M
Home Financials for this Owner
Home Financials are based on the most recent Mortgage that was taken out on this home.
Original Mortgage
$225,000
Interest Rate
7.07%
Purchase Details
Closed on
Feb 14, 1997
Sold by
Oliver Hoffmann Corp
Bought by
Kobler Builders Inc
Create a Home Valuation Report for This Property
The Home Valuation Report is an in-depth analysis detailing your home's value as well as a comparison with similar homes in the area
Home Values in the Area
Average Home Value in this Area
Purchase History
| Date | Buyer | Sale Price | Title Company |
|---|---|---|---|
| Leshock Family Declaration Of Trust | -- | None Listed On Document | |
| Leshock John C | $795,000 | First American Title | |
| Benedetto Bruce R | $433,500 | Chicago Title Insurance Co | |
| Kobler Builders Inc | $115,000 | -- |
Source: Public Records
Mortgage History
| Date | Status | Borrower | Loan Amount |
|---|---|---|---|
| Previous Owner | Leshock John C | $636,000 | |
| Previous Owner | Benedetto Bruce R | $225,000 | |
| Closed | Benedetto Bruce R | $70,000 |
Source: Public Records
Tax History Compared to Growth
Tax History
| Year | Tax Paid | Tax Assessment Tax Assessment Total Assessment is a certain percentage of the fair market value that is determined by local assessors to be the total taxable value of land and additions on the property. | Land | Improvement |
|---|---|---|---|---|
| 2024 | $16,349 | $257,608 | $60,808 | $196,800 |
| 2023 | $16,349 | $227,569 | $53,717 | $173,852 |
| 2022 | $14,867 | $211,203 | $50,815 | $160,388 |
| 2021 | $14,215 | $201,145 | $48,395 | $152,750 |
| 2020 | $13,946 | $197,958 | $47,628 | $150,330 |
| 2019 | $13,710 | $192,379 | $46,286 | $146,093 |
| 2018 | $13,798 | $190,195 | $45,268 | $144,927 |
| 2017 | $13,590 | $185,285 | $44,099 | $141,186 |
| 2016 | $13,567 | $181,297 | $43,150 | $138,147 |
| 2015 | $14,589 | $174,324 | $41,490 | $132,834 |
| 2014 | $14,589 | $183,359 | $42,120 | $141,239 |
| 2013 | $14,589 | $183,359 | $42,120 | $141,239 |
Source: Public Records
Map
Nearby Homes
- 1736 Robert Ln
- 1804 Princess Cir
- 2255 Wendt Cir
- 1112 Saratoga Ct
- 4007 Heron Ct Unit 1
- 2711 Wait Rd
- 3816 Rosada Dr
- 3616 Eliot Ln
- 620 Redtop Way
- 620 Switchgrass Way Unit 61006
- 2339 Ryegrass Ln Unit 64005
- 2335 Ryegrass Ln Unit 64004
- 29W316 Andermann Dr
- 668 Switchgrass Way Unit 58004
- 688 Switchgrass Way Unit 57003
- 596 Redtop Way
- 592 Redtop Way
- 588 Redtop Way
- 1987 Baldwin Way
- 2241 Bent Grass Way
- 1815 Baybrook Ct
- 1823 Baybrook Ct
- 1811 Baybrook Ct
- 1827 Baybrook Ct
- 1824 Baybrook Ct
- 1820 Baybrook Ct
- 1828 Baybrook Ct
- 4339 Camelot Cir
- 4343 Camelot Cir
- 1816 Baybrook Ct
- 4335 Camelot Cir
- 1832 Baybrook Ct
- 4347 Camelot Cir
- 1807 Baybrook Ct
- 1831 Baybrook Ct
- 1812 Baybrook Ct
- 4351 Camelot Cir Unit 1
- 4331 Camelot Cir
- 4603 Clearwater Ln
- 4547 Clearwater Ln