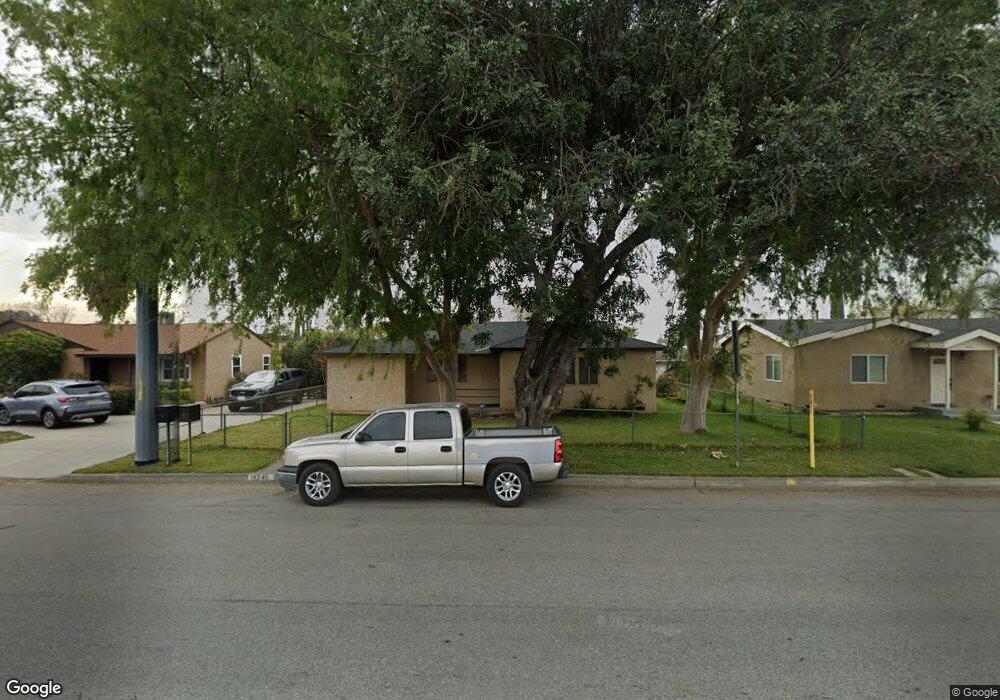
18245 Merrill Ave Fontana, CA 92335
Estimated Value: $534,589 - $605,000
2
Beds
2
Baths
1,517
Sq Ft
$374/Sq Ft
Est. Value
About This Home
This home is located at 18245 Merrill Ave, Fontana, CA 92335 and is currently estimated at $567,147, approximately $373 per square foot. 18245 Merrill Ave is a home located in San Bernardino County with nearby schools including Maple Elementary School, Alder Middle School, and Jurupa Hills High School.
Ownership History
Date
Name
Owned For
Owner Type
Purchase Details
Closed on
Mar 26, 2014
Sold by
Hren John L
Bought by
Hren John L and Abraham Laronda L
Current Estimated Value
Purchase Details
Closed on
Feb 11, 2013
Sold by
Hren John L and Hren John
Bought by
Hren John L
Home Financials for this Owner
Home Financials are based on the most recent Mortgage that was taken out on this home.
Original Mortgage
$85,200
Interest Rate
3.29%
Mortgage Type
New Conventional
Purchase Details
Closed on
Jan 12, 2004
Sold by
Hren La Ronda L
Bought by
Hren John
Home Financials for this Owner
Home Financials are based on the most recent Mortgage that was taken out on this home.
Original Mortgage
$84,300
Interest Rate
5.79%
Mortgage Type
New Conventional
Purchase Details
Closed on
Aug 23, 1994
Sold by
Hren La Ronda L
Bought by
Hren La Ronda L
Home Financials for this Owner
Home Financials are based on the most recent Mortgage that was taken out on this home.
Original Mortgage
$56,500
Interest Rate
8.8%
Mortgage Type
FHA
Create a Home Valuation Report for This Property
The Home Valuation Report is an in-depth analysis detailing your home's value as well as a comparison with similar homes in the area
Home Values in the Area
Average Home Value in this Area
Purchase History
| Date | Buyer | Sale Price | Title Company |
|---|---|---|---|
| Hren John L | -- | None Available | |
| Hren John L | -- | Fidelity National Title Co | |
| Hren John | -- | Commonwealth Title | |
| Hren La Ronda L | -- | Northern Counties Title Ins |
Source: Public Records
Mortgage History
| Date | Status | Borrower | Loan Amount |
|---|---|---|---|
| Closed | Hren John L | $85,200 | |
| Closed | Hren John | $84,300 | |
| Closed | Hren La Ronda L | $56,500 |
Source: Public Records
Tax History Compared to Growth
Tax History
| Year | Tax Paid | Tax Assessment Tax Assessment Total Assessment is a certain percentage of the fair market value that is determined by local assessors to be the total taxable value of land and additions on the property. | Land | Improvement |
|---|---|---|---|---|
| 2025 | $2,058 | $155,608 | $38,899 | $116,709 |
| 2024 | $2,058 | $152,557 | $38,136 | $114,421 |
| 2023 | $1,582 | $149,565 | $37,388 | $112,177 |
| 2022 | $1,576 | $146,632 | $36,655 | $109,977 |
| 2021 | $1,556 | $143,757 | $35,936 | $107,821 |
| 2020 | $1,552 | $142,283 | $35,568 | $106,715 |
| 2019 | $1,505 | $139,494 | $34,871 | $104,623 |
| 2018 | $1,528 | $136,759 | $34,187 | $102,572 |
| 2017 | $1,520 | $134,078 | $33,517 | $100,561 |
| 2016 | $1,494 | $131,449 | $32,860 | $98,589 |
| 2015 | $1,475 | $129,474 | $32,366 | $97,108 |
| 2014 | $1,477 | $126,938 | $31,732 | $95,206 |
Source: Public Records
Map
Nearby Homes
- 9050 Dumond Dr
- 8795 Frankfort St
- 18239 Orange Way
- 1510 W Merrill Ave
- 17962 Merrill Ave
- 1560 W Athol St
- 18264 Pine Ave Unit a & B
- 18264 Pine Ave
- 806 S Sandalwood Ave
- 1459 W James St
- 17903 Dorsey Way
- 8560 Buckeye Dr
- 18013 Arrow Blvd
- 18100 Arrow Blvd
- 250 N Linden Ave Unit 57
- 250 N Linden Ave Unit 9
- 250 N Linden Ave Unit 124
- 250 N Linden Ave Unit 327
- 250 N Linden Ave Unit 250
- 250 N Linden Ave
- 18251 Merrill Ave
- 18233 Merrill Ave
- 18263 Merrill Ave
- 18221 Merrill Ave
- 8934 Dumond Dr
- 8940 Dumond Dr
- 18238 Merrill Ave
- 8939 Williams Rd
- 18275 Merrill Ave
- 18209 Merrill Ave
- 8933 Dumond Dr
- 8933 Williams Rd
- 8950 Dumond Dr
- 18214 Merrill Ave
- 8877 Williams Rd
- 18283 Merrill Ave
- 18195 Merrill Ave
- 8949 Williams Rd
- 18246 Merrill Ave
- 8939 Dumond Dr