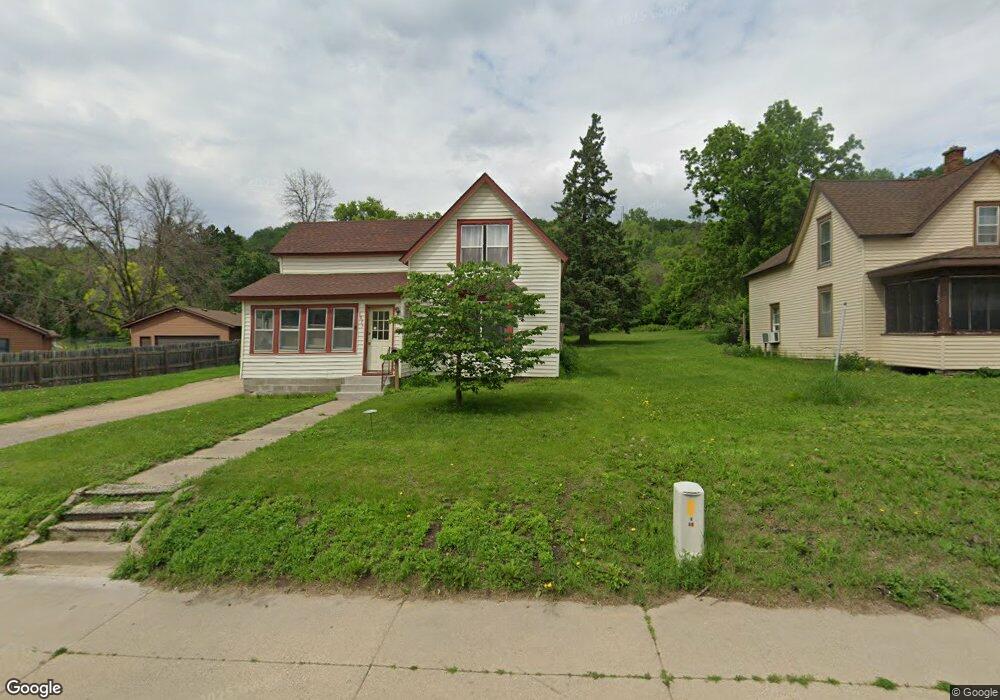
1825 Bush St Red Wing, MN 55066
Estimated Value: $198,000 - $258,000
3
Beds
2
Baths
1,350
Sq Ft
$168/Sq Ft
Est. Value
About This Home
This home is located at 1825 Bush St, Red Wing, MN 55066 and is currently estimated at $226,285, approximately $167 per square foot. 1825 Bush St is a home located in Goodhue County with nearby schools including Sunnyside Elementary School, Burnside Elementary School, and Twin Bluff Middle School.
Ownership History
Date
Name
Owned For
Owner Type
Purchase Details
Closed on
Sep 1, 2021
Sold by
Hager Barry J and Hager Debra M
Bought by
Sullivan Jesse A
Current Estimated Value
Purchase Details
Closed on
Dec 30, 2014
Sold by
Hager Barry J and Hager Debra M
Bought by
Sullivan Jesse A
Purchase Details
Closed on
Jun 30, 2014
Sold by
Stream Loren and Stream Christine
Bought by
Hager Barry J
Purchase Details
Closed on
Nov 12, 2007
Sold by
Federal National Mortgage Association
Bought by
Hotchkiss Matthew
Purchase Details
Closed on
Nov 22, 1996
Sold by
Orr Dorene
Bought by
Orr Thomas W and Orr Karin J
Create a Home Valuation Report for This Property
The Home Valuation Report is an in-depth analysis detailing your home's value as well as a comparison with similar homes in the area
Home Values in the Area
Average Home Value in this Area
Purchase History
| Date | Buyer | Sale Price | Title Company |
|---|---|---|---|
| Sullivan Jesse A | $57,900 | Knight Barry Ttl United Llc | |
| Sullivan Jesse A | -- | Attorney | |
| Hager Barry J | -- | Attorney | |
| Hotchkiss Matthew | $49,900 | -- | |
| Orr Thomas W | $43,000 | -- |
Source: Public Records
Tax History Compared to Growth
Tax History
| Year | Tax Paid | Tax Assessment Tax Assessment Total Assessment is a certain percentage of the fair market value that is determined by local assessors to be the total taxable value of land and additions on the property. | Land | Improvement |
|---|---|---|---|---|
| 2025 | $1,678 | $154,200 | $55,300 | $98,900 |
| 2024 | -- | $152,300 | $55,300 | $97,000 |
| 2023 | $1,686 | $145,500 | $55,300 | $90,200 |
| 2022 | $1,498 | $144,900 | $55,300 | $89,600 |
| 2021 | $1,394 | $122,300 | $48,700 | $73,600 |
| 2020 | $1,312 | $116,700 | $48,700 | $68,000 |
| 2019 | $1,226 | $105,600 | $48,700 | $56,900 |
| 2018 | $984 | $101,500 | $44,300 | $57,200 |
| 2017 | $1,336 | $92,400 | $44,300 | $48,100 |
| 2016 | $1,340 | $91,600 | $44,300 | $47,300 |
| 2015 | $954 | $96,200 | $44,300 | $51,900 |
| 2014 | -- | $93,400 | $44,300 | $49,100 |
Source: Public Records
Map
Nearby Homes