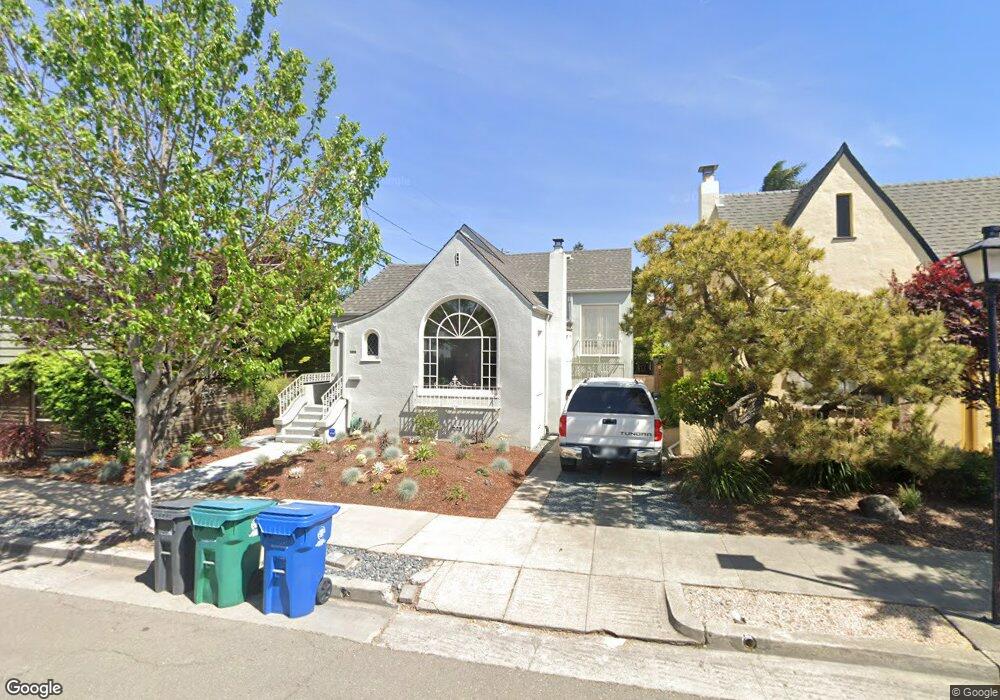
1826 Moreland Dr Alameda, CA 94501
Downtown Alameda NeighborhoodEstimated Value: $1,184,353 - $1,766,000
2
Beds
1
Bath
1,498
Sq Ft
$969/Sq Ft
Est. Value
About This Home
This home is located at 1826 Moreland Dr, Alameda, CA 94501 and is currently estimated at $1,451,838, approximately $969 per square foot. 1826 Moreland Dr is a home located in Alameda County with nearby schools including Edison Elementary School, Lincoln Middle School, and Alameda High School.
Ownership History
Date
Name
Owned For
Owner Type
Purchase Details
Closed on
Jul 9, 2010
Sold by
Ingram Jere W
Bought by
Ingram Jere W and The Jere W Ingram Trust
Current Estimated Value
Purchase Details
Closed on
Apr 14, 2009
Sold by
Lorenz Deeahna
Bought by
Ingram Jere W
Home Financials for this Owner
Home Financials are based on the most recent Mortgage that was taken out on this home.
Original Mortgage
$408,000
Interest Rate
5.02%
Mortgage Type
New Conventional
Purchase Details
Closed on
Apr 4, 2009
Sold by
Lorenz Deeahna M
Bought by
Ingram Jere W
Home Financials for this Owner
Home Financials are based on the most recent Mortgage that was taken out on this home.
Original Mortgage
$408,000
Interest Rate
5.02%
Mortgage Type
New Conventional
Purchase Details
Closed on
Apr 23, 2002
Sold by
Ingram Jere W and Lorenz Deeahna
Bought by
Ingram Jere W and Lorenz Deeahna M
Home Financials for this Owner
Home Financials are based on the most recent Mortgage that was taken out on this home.
Original Mortgage
$238,937
Interest Rate
7.13%
Create a Home Valuation Report for This Property
The Home Valuation Report is an in-depth analysis detailing your home's value as well as a comparison with similar homes in the area
Home Values in the Area
Average Home Value in this Area
Purchase History
| Date | Buyer | Sale Price | Title Company |
|---|---|---|---|
| Ingram Jere W | -- | None Available | |
| Ingram Jere W | -- | None Available | |
| Ingram Jere W | -- | First American Title Company | |
| Ingram Jere W | -- | Landsafe Title |
Source: Public Records
Mortgage History
| Date | Status | Borrower | Loan Amount |
|---|---|---|---|
| Closed | Ingram Jere W | $408,000 | |
| Closed | Ingram Jere W | $238,937 | |
| Closed | Ingram Jere W | $40,000 |
Source: Public Records
Tax History Compared to Growth
Tax History
| Year | Tax Paid | Tax Assessment Tax Assessment Total Assessment is a certain percentage of the fair market value that is determined by local assessors to be the total taxable value of land and additions on the property. | Land | Improvement |
|---|---|---|---|---|
| 2025 | $8,114 | $508,840 | $154,752 | $361,088 |
| 2024 | $8,114 | $498,727 | $151,718 | $354,009 |
| 2023 | $7,821 | $495,811 | $148,743 | $347,068 |
| 2022 | $7,652 | $479,090 | $145,827 | $340,263 |
| 2021 | $7,473 | $469,561 | $142,968 | $333,593 |
| 2020 | $8,807 | $471,676 | $141,503 | $330,173 |
| 2019 | $6,879 | $462,430 | $138,729 | $323,701 |
| 2018 | $6,712 | $453,364 | $136,009 | $317,355 |
| 2017 | $6,420 | $444,474 | $133,342 | $311,132 |
| 2016 | $6,419 | $435,760 | $130,728 | $305,032 |
| 2015 | $6,395 | $429,217 | $128,765 | $300,452 |
| 2014 | $6,119 | $420,811 | $126,243 | $294,568 |
Source: Public Records
Map
Nearby Homes
- 1818 Fremont Dr
- 1831 Harvard Dr
- 3029 Thompson Ave
- 1601 Broadway Unit 9
- 3114 Thompson Ave
- 2022 High St Unit A
- 2853 Regatta Dr Unit 179
- 3103 Central Ave
- 303 Bowsman Ct Unit 144
- 3246 Garfield Ave
- 340 29th Ave Unit 207
- 340 29th Ave Unit 204
- 2310 Pacific Ave
- 1238 Versailles Ave
- 2620 Encinal Ave
- 2417 Marti Rae Ct
- 1611 Lea Ct
- 3957 Wattling St
- 2754 E 7th St
- 1210 Broadway Unit A
- 1822 Moreland Dr
- 2824 Fernside Blvd
- 1838 Moreland Dr
- 1818 Moreland Dr
- 2826 Fernside Blvd
- 1827 Cambridge Dr
- 1823 Cambridge Dr
- 2830 Fernside Blvd
- 1814 Moreland Dr
- 1819 Cambridge Dr
- 1831 Moreland Dr
- 1835 Cambridge Dr
- 1823 Moreland Dr
- 1815 Cambridge Dr
- 1810 Moreland Dr
- 1819 Moreland Dr
- 2810 Fernside Blvd
- 1811 Cambridge Dr
- 1815 Moreland Dr
- 2808 Fernside Blvd