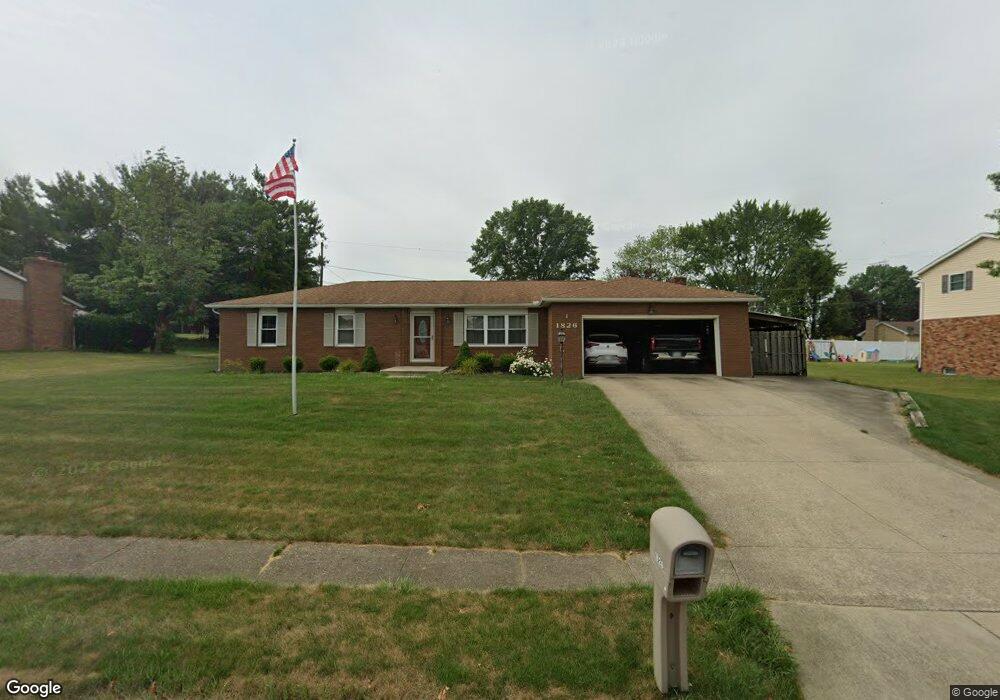
1826 Opal St Louisville, OH 44641
Estimated Value: $235,482 - $279,000
3
Beds
2
Baths
1,554
Sq Ft
$166/Sq Ft
Est. Value
About This Home
This home is located at 1826 Opal St, Louisville, OH 44641 and is currently estimated at $257,621, approximately $165 per square foot. 1826 Opal St is a home located in Stark County with nearby schools including Louisville High School and St. Thomas Aquinas High School & Middle School.
Ownership History
Date
Name
Owned For
Owner Type
Purchase Details
Closed on
Jan 23, 2004
Sold by
Ablett Daniel P
Bought by
Alborn Douglas E and Alborn Anna M
Current Estimated Value
Home Financials for this Owner
Home Financials are based on the most recent Mortgage that was taken out on this home.
Original Mortgage
$113,600
Outstanding Balance
$53,163
Interest Rate
5.91%
Mortgage Type
Purchase Money Mortgage
Estimated Equity
$204,458
Purchase Details
Closed on
May 8, 2001
Sold by
Ablett Martha Jane
Bought by
Ablett Daniel P and The Daniel P Ablett Revocable Trust
Purchase Details
Closed on
Oct 9, 1990
Create a Home Valuation Report for This Property
The Home Valuation Report is an in-depth analysis detailing your home's value as well as a comparison with similar homes in the area
Home Values in the Area
Average Home Value in this Area
Purchase History
| Date | Buyer | Sale Price | Title Company |
|---|---|---|---|
| Alborn Douglas E | $142,000 | -- | |
| Ablett Daniel P | -- | Grimsley Title Agency | |
| -- | $85,000 | -- |
Source: Public Records
Mortgage History
| Date | Status | Borrower | Loan Amount |
|---|---|---|---|
| Open | Alborn Douglas E | $113,600 | |
| Closed | Alborn Douglas E | $28,400 |
Source: Public Records
Tax History Compared to Growth
Tax History
| Year | Tax Paid | Tax Assessment Tax Assessment Total Assessment is a certain percentage of the fair market value that is determined by local assessors to be the total taxable value of land and additions on the property. | Land | Improvement |
|---|---|---|---|---|
| 2025 | -- | $68,250 | $17,010 | $51,240 |
| 2024 | -- | $68,250 | $17,010 | $51,240 |
| 2023 | $2,491 | $57,960 | $16,030 | $41,930 |
| 2022 | $2,497 | $57,960 | $16,030 | $41,930 |
| 2021 | $2,504 | $57,960 | $16,030 | $41,930 |
| 2020 | $2,066 | $51,950 | $14,460 | $37,490 |
| 2019 | $2,168 | $52,540 | $14,460 | $38,080 |
| 2018 | $2,090 | $52,540 | $14,460 | $38,080 |
| 2017 | $1,938 | $47,010 | $12,710 | $34,300 |
| 2016 | $1,978 | $47,010 | $12,710 | $34,300 |
| 2015 | $1,984 | $47,010 | $12,710 | $34,300 |
| 2014 | $1,844 | $40,610 | $10,960 | $29,650 |
| 2013 | $925 | $40,610 | $10,960 | $29,650 |
Source: Public Records
Map
Nearby Homes
- 2110 Edmar St
- 1715 High St
- 1812 E Broad St
- 641 S Nickelplate St
- 520 S Silver St
- 308 Superior St
- 908 Sand Lot Cir
- 3390 Meese Rd NE
- 728 E Broad St
- 2015 E Main St
- 0 Michigan Blvd
- 510 S Bauman Ct
- 204 E Broad St
- 107 E Broad St
- 325 Lincoln Ave
- 8225 Georgetown St
- 1702 View Pointe Ave
- 1639 Horizon Dr
- 1170 Winding Ridge Ave
- 910 Crosswyck Cir