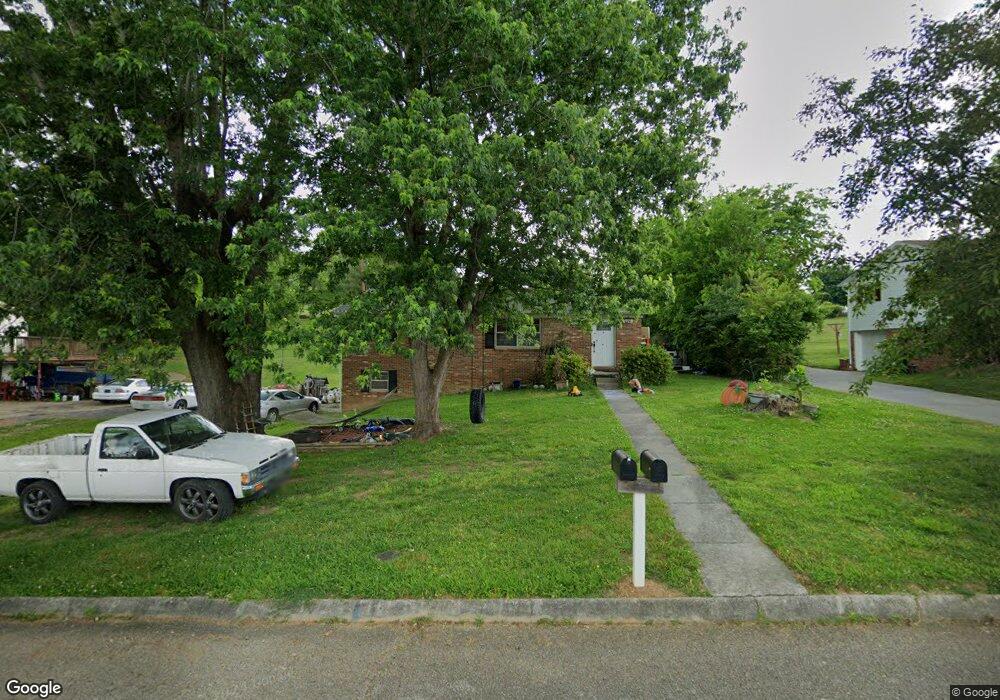
1831 Pembrook Dr Morristown, TN 37813
Estimated Value: $99,000 - $270,000
--
Bed
1
Bath
1,161
Sq Ft
$166/Sq Ft
Est. Value
About This Home
This home is located at 1831 Pembrook Dr, Morristown, TN 37813 and is currently estimated at $193,137, approximately $166 per square foot. 1831 Pembrook Dr is a home located in Hamblen County with nearby schools including Union Heights Elementary School, East Ridge Middle School, and Morristown East High School.
Ownership History
Date
Name
Owned For
Owner Type
Purchase Details
Closed on
Nov 14, 2013
Sold by
Thompson Vickie
Bought by
Dalton Larry
Current Estimated Value
Purchase Details
Closed on
Aug 14, 1996
Sold by
Mcgowan Wayne A
Bought by
Thompson Vickie
Purchase Details
Closed on
Jan 2, 1992
Bought by
Mcgowan Wayne A and Stephanie Denat
Purchase Details
Closed on
Nov 16, 1990
Bought by
Brock Pamela J
Purchase Details
Closed on
Jun 3, 1987
Purchase Details
Closed on
May 26, 1987
Bought by
Spoone Jewell L
Purchase Details
Closed on
Feb 12, 1987
Bought by
Spoone Mitchell O and Spoone Jewell L
Purchase Details
Closed on
Jul 8, 1986
Bought by
Preston Timothy E and Preston Elizabeth B
Purchase Details
Closed on
Apr 21, 1983
Bought by
Davis Ronnie A and Ellenburg Cynthia
Purchase Details
Closed on
Jun 24, 1977
Bought by
Lewis Bruce E and Lewis Delores C
Create a Home Valuation Report for This Property
The Home Valuation Report is an in-depth analysis detailing your home's value as well as a comparison with similar homes in the area
Home Values in the Area
Average Home Value in this Area
Purchase History
| Date | Buyer | Sale Price | Title Company |
|---|---|---|---|
| Dalton Larry | $39,781 | -- | |
| Thompson Vickie | $70,900 | -- | |
| Mcgowan Wayne A | $44,800 | -- | |
| Brock Pamela J | -- | -- | |
| -- | $40,200 | -- | |
| Brock Ben C | -- | -- | |
| Spoone Jewell L | -- | -- | |
| Spoone Mitchell O | -- | -- | |
| Preston Timothy E | -- | -- | |
| Davis Ronnie A | -- | -- | |
| Lewis Bruce E | -- | -- |
Source: Public Records
Tax History Compared to Growth
Tax History
| Year | Tax Paid | Tax Assessment Tax Assessment Total Assessment is a certain percentage of the fair market value that is determined by local assessors to be the total taxable value of land and additions on the property. | Land | Improvement |
|---|---|---|---|---|
| 2024 | $493 | $25,025 | $3,675 | $21,350 |
| 2023 | $493 | $25,025 | $0 | $0 |
| 2022 | $493 | $25,025 | $3,675 | $21,350 |
| 2021 | $493 | $25,025 | $3,675 | $21,350 |
| 2020 | $493 | $25,025 | $3,675 | $21,350 |
| 2019 | $489 | $22,975 | $3,125 | $19,850 |
| 2018 | $489 | $22,975 | $3,125 | $19,850 |
| 2017 | $489 | $22,975 | $3,125 | $19,850 |
| 2016 | $457 | $22,975 | $3,125 | $19,850 |
| 2015 | $425 | $22,975 | $3,125 | $19,850 |
| 2014 | -- | $22,975 | $3,125 | $19,850 |
| 2013 | -- | $24,525 | $0 | $0 |
Source: Public Records
Map
Nearby Homes
- 1845 Pembrook Dr
- 1821 Pembrook Dr
- 1834 Carroll Rd
- 1850 Carroll Rd
- 1857 Pembrook Dr
- 1807 Pembrook Dr
- 1830 Pembrook Dr
- 1824 Pembrook Dr
- 1840 Pembrook Dr
- 1862 Carroll Rd
- 1860 Pembrook Dr
- 1877 Pembrook Dr
- 1884 Carroll Rd
- 1767 Pembrook Dr
- 1878 Pembrook Dr
- 1885 Pembrook Dr
- 1768 Pembrook Dr
- 1896 Carroll Rd
- 1851 Carroll Rd
- 1894 Pembrook Dr