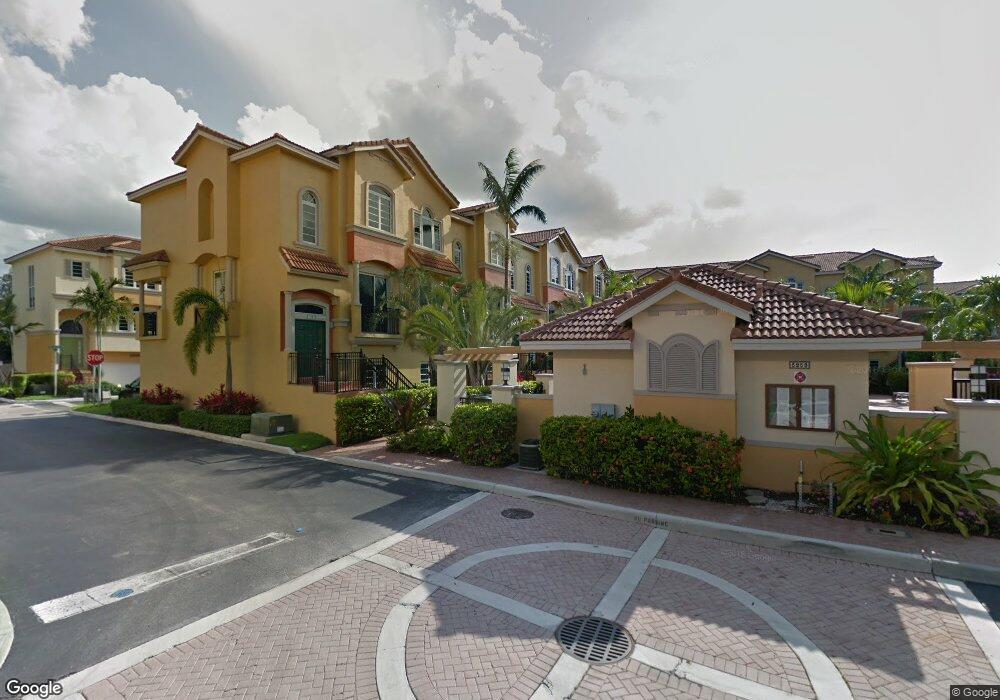
1833 Coral Heights Ln Fort Lauderdale, FL 33308
Central Corals NeighborhoodEstimated Value: $529,000 - $633,000
3
Beds
4
Baths
1,803
Sq Ft
$314/Sq Ft
Est. Value
About This Home
This home is located at 1833 Coral Heights Ln, Fort Lauderdale, FL 33308 and is currently estimated at $565,538, approximately $313 per square foot. 1833 Coral Heights Ln is a home located in Broward County with nearby schools including Oakland Park Elementary School, James S. Rickards Middle School, and Northeast High School.
Ownership History
Date
Name
Owned For
Owner Type
Purchase Details
Closed on
Aug 6, 2020
Sold by
Farley Andrew and Farley Clara
Bought by
Farley Andrew R and Farley Clara
Current Estimated Value
Home Financials for this Owner
Home Financials are based on the most recent Mortgage that was taken out on this home.
Original Mortgage
$259,600
Outstanding Balance
$221,296
Interest Rate
3%
Mortgage Type
New Conventional
Estimated Equity
$344,242
Purchase Details
Closed on
Dec 1, 2016
Sold by
Cascone Nadia and Brunino Silvana
Bought by
Farley Andrew R
Home Financials for this Owner
Home Financials are based on the most recent Mortgage that was taken out on this home.
Original Mortgage
$270,300
Interest Rate
3.52%
Mortgage Type
New Conventional
Purchase Details
Closed on
Mar 5, 2012
Sold by
Mifsud Janka
Bought by
Brunino Silvana
Purchase Details
Closed on
Apr 24, 2007
Sold by
Coral Heights Fladevco Llc
Bought by
Brunino Silvana and Cascone Nadia
Create a Home Valuation Report for This Property
The Home Valuation Report is an in-depth analysis detailing your home's value as well as a comparison with similar homes in the area
Home Values in the Area
Average Home Value in this Area
Purchase History
| Date | Buyer | Sale Price | Title Company |
|---|---|---|---|
| Farley Andrew R | -- | Lawyers Title | |
| Farley Andrew R | $318,000 | Attorney | |
| Brunino Silvana | -- | Attorney | |
| Brunino Silvana | $400,000 | Attorney |
Source: Public Records
Mortgage History
| Date | Status | Borrower | Loan Amount |
|---|---|---|---|
| Open | Farley Andrew R | $259,600 | |
| Closed | Farley Andrew R | $270,300 |
Source: Public Records
Tax History Compared to Growth
Tax History
| Year | Tax Paid | Tax Assessment Tax Assessment Total Assessment is a certain percentage of the fair market value that is determined by local assessors to be the total taxable value of land and additions on the property. | Land | Improvement |
|---|---|---|---|---|
| 2025 | -- | $344,730 | -- | -- |
| 2024 | $6,617 | $335,020 | -- | -- |
| 2023 | $6,617 | $325,270 | $0 | $0 |
| 2022 | $6,294 | $315,800 | $0 | $0 |
| 2021 | $6,032 | $306,610 | $0 | $0 |
| 2020 | $5,859 | $302,380 | $0 | $0 |
| 2019 | $5,671 | $295,590 | $0 | $0 |
| 2018 | $5,454 | $290,080 | $39,480 | $250,600 |
| 2017 | $5,534 | $288,920 | $0 | $0 |
| 2016 | $6,002 | $250,060 | $0 | $0 |
| 2015 | $5,756 | $227,330 | $0 | $0 |
| 2014 | $5,294 | $206,670 | $0 | $0 |
| 2013 | -- | $198,660 | $39,480 | $159,180 |
Source: Public Records
Map
Nearby Homes
- 1861 Coral Heights Blvd Unit 502
- 4010 NE 18th Ave
- 1951 Coral Heights Blvd Unit 402
- 4017 NE 18th Ave
- 3900 NE 18th Ave Unit 36H
- 4025 N Federal Hwy Unit 226C
- 4025 N Federal Hwy Unit 224B
- 4025 N Federal Hwy Unit 324C
- 4025 N Federal Hwy Unit 312A
- 1831 NE 38th St Unit 402
- 1831 NE 38th St Unit 410
- 1831 NE 38th St Unit 207
- 4021 NE 17th Terrace
- 1711 NE 40th Ct
- 1911 NE 41st St
- 4110 NE 20th Ave
- 4120 NE 20th Ave
- 3909 NE 21st Ave Unit 1
- 1611 NE 40th Place
- 3697 NE 19th Ave
- 1833 Coral Heights Ln Unit 1833
- 1833 Coral Heights Ln
- 1843 Coral Heights Ln
- 1823 Coral Heights Ln
- 1853 Coral Heights Ln
- 1853 Coral Heights Ln
- 1813 Coral Heights Ln
- 3932 Coral Heights Way
- 3942 Coral Heights Way
- 3952 Coral Heights Way
- 3962 Coral Heights Way
- 3972 Coral Heights Way
- 3952 3952 Coral Heights Way # 3952 Unit 3952
- 1863 Coral Heights Ln Unit 601
- 1863 Coral Heights Ln Unit 1863
- 1863 Coral Heights Ln
- 1832 Coral Heights Ln
- 1842 Coral Heights Ln
- 1822 Coral Heights Ln
- 1852 Coral Heights Ln