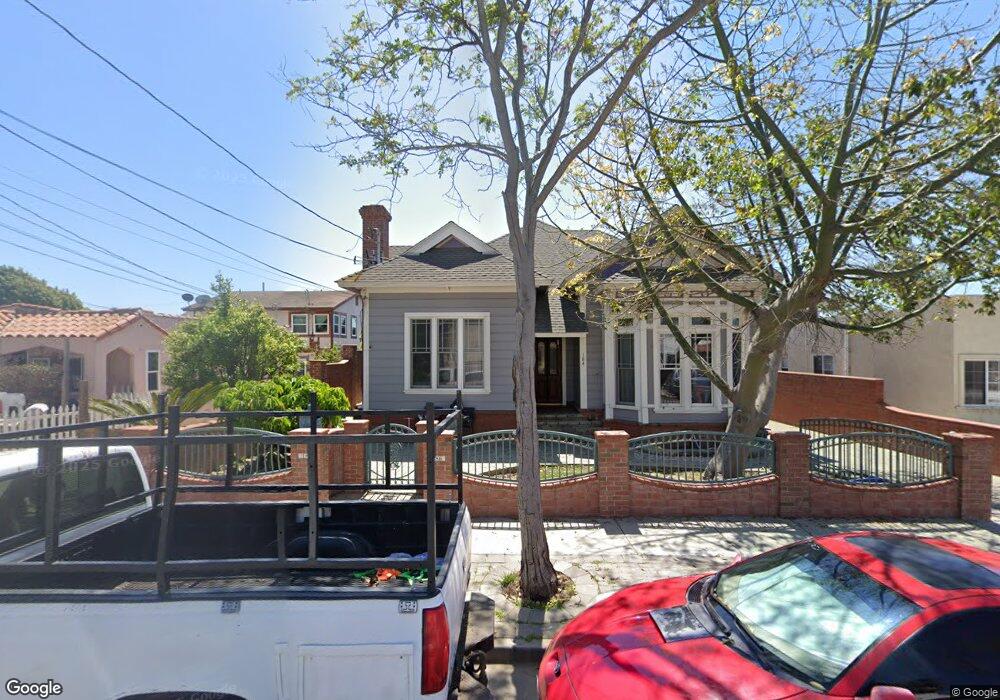
184 W Mission Ave Ventura, CA 93001
Westside NeighborhoodEstimated Value: $897,000 - $1,058,000
4
Beds
3
Baths
2,151
Sq Ft
$471/Sq Ft
Est. Value
About This Home
This home is located at 184 W Mission Ave, Ventura, CA 93001 and is currently estimated at $1,012,690, approximately $470 per square foot. 184 W Mission Ave is a home located in Ventura County with nearby schools including Will Rogers Elementary School, De Anza Academy Of Technology And The Arts, and Ventura High School.
Ownership History
Date
Name
Owned For
Owner Type
Purchase Details
Closed on
Oct 27, 2009
Sold by
Holladay Thomas R
Bought by
Mefford Brandon A and Mefford Tory
Current Estimated Value
Home Financials for this Owner
Home Financials are based on the most recent Mortgage that was taken out on this home.
Original Mortgage
$338,827
Interest Rate
5.01%
Mortgage Type
FHA
Purchase Details
Closed on
Sep 6, 2005
Sold by
Holladay Gertrude H
Bought by
Holladay Thomas R
Home Financials for this Owner
Home Financials are based on the most recent Mortgage that was taken out on this home.
Original Mortgage
$576,000
Interest Rate
6.5%
Mortgage Type
Purchase Money Mortgage
Purchase Details
Closed on
Nov 3, 1999
Sold by
Palmer Robert P and Palmer Maia E Lowenschuss
Bought by
Holladay Thomas R and Holladay Gertrude H
Home Financials for this Owner
Home Financials are based on the most recent Mortgage that was taken out on this home.
Original Mortgage
$170,800
Interest Rate
7.68%
Mortgage Type
Balloon
Create a Home Valuation Report for This Property
The Home Valuation Report is an in-depth analysis detailing your home's value as well as a comparison with similar homes in the area
Home Values in the Area
Average Home Value in this Area
Purchase History
| Date | Buyer | Sale Price | Title Company |
|---|---|---|---|
| Mefford Brandon A | $370,000 | Fidelity National Title Co | |
| Holladay Thomas R | $288,000 | Gateway Title Company | |
| Holladay Thomas R | $213,500 | Chicago Title Co |
Source: Public Records
Mortgage History
| Date | Status | Borrower | Loan Amount |
|---|---|---|---|
| Previous Owner | Mefford Brandon A | $338,827 | |
| Previous Owner | Holladay Thomas R | $576,000 | |
| Previous Owner | Holladay Thomas R | $170,800 | |
| Closed | Holladay Thomas R | $42,700 |
Source: Public Records
Tax History Compared to Growth
Tax History
| Year | Tax Paid | Tax Assessment Tax Assessment Total Assessment is a certain percentage of the fair market value that is determined by local assessors to be the total taxable value of land and additions on the property. | Land | Improvement |
|---|---|---|---|---|
| 2025 | $6,890 | $634,969 | $349,910 | $285,059 |
| 2024 | $6,890 | $622,519 | $343,049 | $279,470 |
| 2023 | $6,807 | $610,313 | $336,322 | $273,991 |
| 2022 | $4,796 | $450,044 | $194,613 | $255,431 |
| 2021 | $4,705 | $441,220 | $190,797 | $250,423 |
| 2020 | $4,661 | $436,698 | $188,842 | $247,856 |
| 2019 | $4,575 | $428,137 | $185,140 | $242,997 |
| 2018 | $4,500 | $419,743 | $181,510 | $238,233 |
| 2017 | $4,406 | $411,513 | $177,951 | $233,562 |
| 2016 | $4,320 | $403,445 | $174,462 | $228,983 |
| 2015 | $4,275 | $397,388 | $171,843 | $225,545 |
| 2014 | $4,205 | $389,588 | $168,470 | $221,118 |
Source: Public Records
Map
Nearby Homes
- 295 W Mission Ave
- 326 W Mission Ave
- 285 N Ventura Ave Unit 5
- 285 N Ventura Ave Unit 6
- 367 W Harrison Ave
- 323 Wall St
- 257 Cedar St
- 100 E Center St
- 130 N Garden St Unit 3248
- 657 Sheridan Way
- 49 Mission Plaza Dr Unit 30
- 557 561 N North Olive St
- 467 W Simpson St
- 281 W Main St
- 0 Cedar St Unit PW25039713
- 885 Riverside St
- 104 W Santa Clara St Unit 16
- 436 Poli St Unit 404
- 216 E Lewis St
- 732 Poli St
- 170 W Mission Ave
- 192 W Mission Ave Unit 2
- 192 W Mission Ave
- 192 W Mission Ave
- 332 N Olive St
- 332 N Olive St
- 196 W Mission Ave
- 160 W Mission Ave
- 163 W Park Row Ave
- 183 W Park Row Ave Unit 102
- 183 W Park Row Ave
- 169 W Park Row Ave
- 191 W Mission Ave
- 187 W Park Row Ave Unit 102
- 150 W Mission Ave
- 331 N Olive St
- 349 N Olive St
- 349 N Olive St
- 161 W Park Row Ave
- 187 W Mission Ave