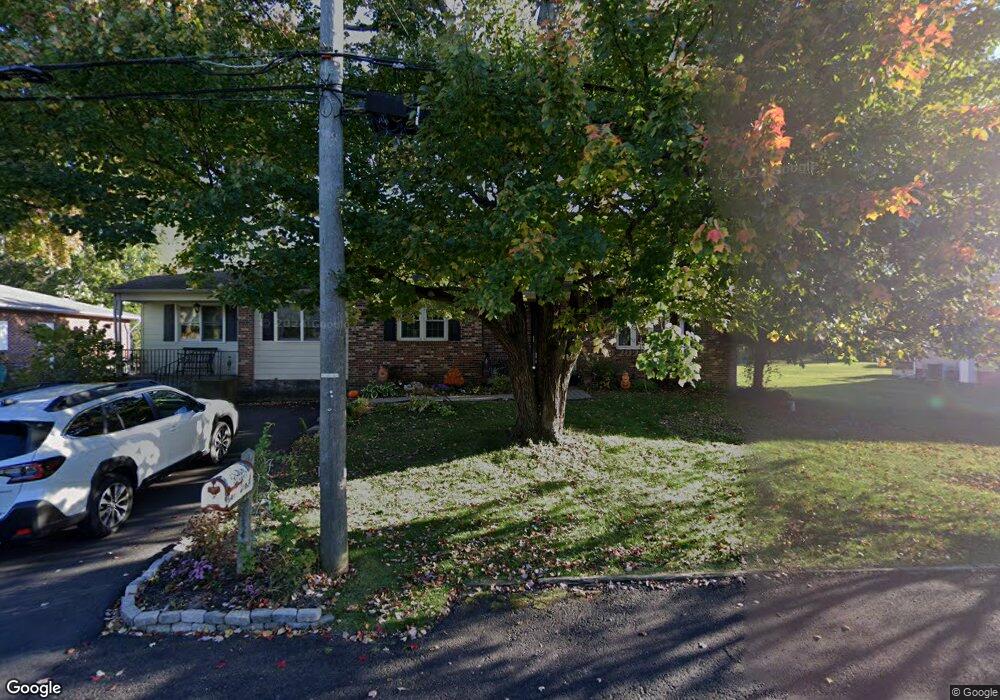
1843 4th St Langhorne, PA 19047
Estimated Value: $610,000 - $639,000
4
Beds
4
Baths
2,496
Sq Ft
$251/Sq Ft
Est. Value
About This Home
This home is located at 1843 4th St, Langhorne, PA 19047 and is currently estimated at $625,888, approximately $250 per square foot. 1843 4th St is a home located in Bucks County with nearby schools including Pearl S. Buck Elementary School, Maple Point Middle School, and Neshaminy High School.
Ownership History
Date
Name
Owned For
Owner Type
Purchase Details
Closed on
Mar 27, 1996
Sold by
Citicorp Mtg Inc
Bought by
Liberty Patrick and Liberty Lisa R
Current Estimated Value
Home Financials for this Owner
Home Financials are based on the most recent Mortgage that was taken out on this home.
Original Mortgage
$122,000
Outstanding Balance
$5,737
Interest Rate
7.34%
Estimated Equity
$620,151
Purchase Details
Closed on
Jan 5, 1996
Sold by
Michaels Lawrence R
Bought by
Citicorp Mtg Inc
Create a Home Valuation Report for This Property
The Home Valuation Report is an in-depth analysis detailing your home's value as well as a comparison with similar homes in the area
Home Values in the Area
Average Home Value in this Area
Purchase History
| Date | Buyer | Sale Price | Title Company |
|---|---|---|---|
| Liberty Patrick | $128,500 | -- | |
| Citicorp Mtg Inc | $692 | -- |
Source: Public Records
Mortgage History
| Date | Status | Borrower | Loan Amount |
|---|---|---|---|
| Open | Liberty Patrick | $122,000 |
Source: Public Records
Tax History Compared to Growth
Tax History
| Year | Tax Paid | Tax Assessment Tax Assessment Total Assessment is a certain percentage of the fair market value that is determined by local assessors to be the total taxable value of land and additions on the property. | Land | Improvement |
|---|---|---|---|---|
| 2025 | $7,080 | $32,520 | $3,480 | $29,040 |
| 2024 | $7,080 | $32,520 | $3,480 | $29,040 |
| 2023 | $6,967 | $32,520 | $3,480 | $29,040 |
| 2022 | $6,784 | $32,520 | $3,480 | $29,040 |
| 2021 | $6,784 | $32,520 | $3,480 | $29,040 |
| 2020 | $6,703 | $32,520 | $3,480 | $29,040 |
| 2019 | $3,120 | $32,520 | $3,480 | $29,040 |
| 2018 | $6,433 | $32,520 | $3,480 | $29,040 |
| 2017 | $6,269 | $32,520 | $3,480 | $29,040 |
| 2016 | $6,269 | $32,520 | $3,480 | $29,040 |
| 2015 | $6,458 | $32,520 | $3,480 | $29,040 |
| 2014 | $6,458 | $32,520 | $3,480 | $29,040 |
Source: Public Records
Map
Nearby Homes