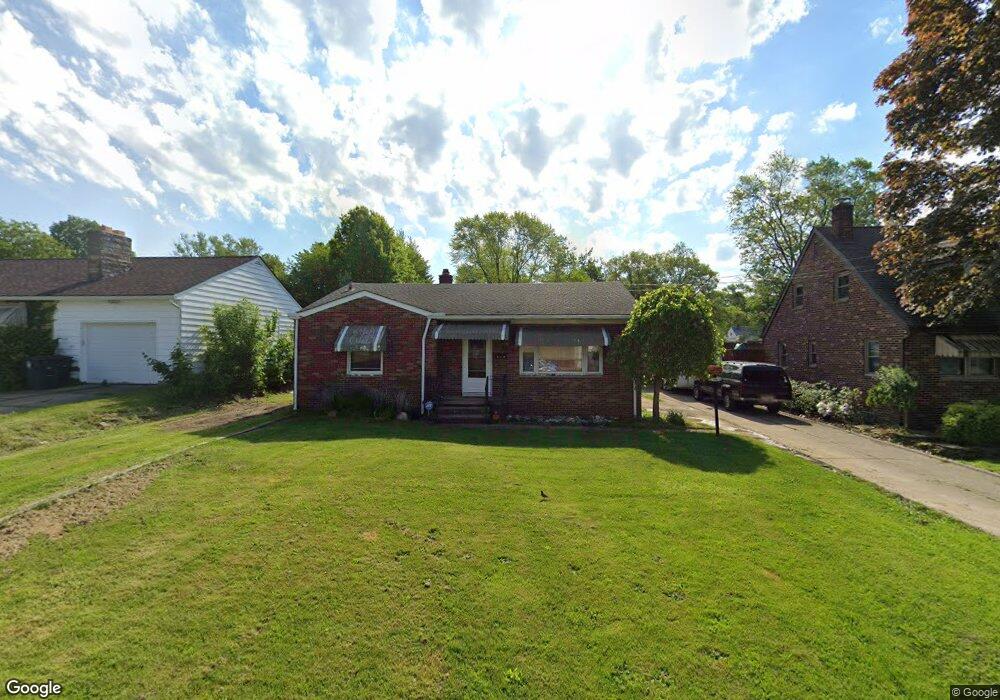
1843 Dallas Ave Akron, OH 44301
Firestone Park NeighborhoodEstimated Value: $157,000 - $191,000
3
Beds
1
Bath
1,162
Sq Ft
$148/Sq Ft
Est. Value
About This Home
This home is located at 1843 Dallas Ave, Akron, OH 44301 and is currently estimated at $172,150, approximately $148 per square foot. 1843 Dallas Ave is a home located in Summit County with nearby schools including Kenmore Garfield Community Learning Center, Main Preparatory Academy, and Eagle Elementary.
Ownership History
Date
Name
Owned For
Owner Type
Purchase Details
Closed on
Oct 27, 2001
Sold by
Molesky Stacie A and Molesky Stacie A
Bought by
Weisbarth James M
Current Estimated Value
Home Financials for this Owner
Home Financials are based on the most recent Mortgage that was taken out on this home.
Original Mortgage
$104,362
Outstanding Balance
$41,271
Interest Rate
6.88%
Mortgage Type
FHA
Estimated Equity
$130,879
Purchase Details
Closed on
Nov 24, 1998
Sold by
Molesky Donald A
Bought by
Molesky Stacie A
Purchase Details
Closed on
May 5, 1995
Sold by
Jenkins Grace T
Bought by
Molesky Donald A and Molesky Stacie A
Home Financials for this Owner
Home Financials are based on the most recent Mortgage that was taken out on this home.
Original Mortgage
$71,200
Interest Rate
8.43%
Mortgage Type
New Conventional
Create a Home Valuation Report for This Property
The Home Valuation Report is an in-depth analysis detailing your home's value as well as a comparison with similar homes in the area
Home Values in the Area
Average Home Value in this Area
Purchase History
| Date | Buyer | Sale Price | Title Company |
|---|---|---|---|
| Weisbarth James M | $106,000 | Midland Commerce Group | |
| Molesky Stacie A | -- | Minnesota Title | |
| Molesky Donald A | $75,000 | -- |
Source: Public Records
Mortgage History
| Date | Status | Borrower | Loan Amount |
|---|---|---|---|
| Open | Weisbarth James M | $104,362 | |
| Previous Owner | Molesky Donald A | $71,200 |
Source: Public Records
Tax History Compared to Growth
Tax History
| Year | Tax Paid | Tax Assessment Tax Assessment Total Assessment is a certain percentage of the fair market value that is determined by local assessors to be the total taxable value of land and additions on the property. | Land | Improvement |
|---|---|---|---|---|
| 2025 | $2,651 | $49,708 | $14,382 | $35,326 |
| 2024 | $2,651 | $49,708 | $14,382 | $35,326 |
| 2023 | $2,651 | $49,708 | $14,382 | $35,326 |
| 2022 | $2,501 | $36,764 | $10,423 | $26,341 |
| 2021 | $2,503 | $36,764 | $10,423 | $26,341 |
| 2020 | $2,466 | $36,760 | $10,420 | $26,340 |
| 2019 | $2,345 | $31,640 | $10,420 | $21,220 |
| 2018 | $2,314 | $31,640 | $10,420 | $21,220 |
| 2017 | $2,351 | $31,640 | $10,420 | $21,220 |
| 2016 | $2,353 | $31,640 | $10,420 | $21,220 |
| 2015 | $2,351 | $31,640 | $10,420 | $21,220 |
| 2014 | $2,332 | $31,640 | $10,420 | $21,220 |
| 2013 | $2,370 | $32,880 | $10,420 | $22,460 |
Source: Public Records
Map
Nearby Homes
- 74 E Catawba Ave
- 41 E Rosewood Ave
- 1861 S Main St
- 1637 Rockford St
- 1595 Evergreen Ave
- 37 Selden Ave
- 23 Selden Ave
- 197 E Wilbeth Rd
- 40 E Dresden Ave
- 75 W Dartmore Ave
- 132 Crescent Dr
- 1614 Glenmount Ave
- 291 Selden Ave
- 315 Clinton Ave
- 17 W Woodsdale Ave
- 41 W Woodsdale Ave
- 361 Mission Dr
- 369 Mission Dr
- 55 W Ralston Ave
- 1500 Beardsley St
- 1835 Dallas Ave
- 1847 Dallas Ave
- 1829 Dallas Ave
- 89 Youtz Ave
- 1855 Dallas Ave
- 1825 Dallas Ave
- 85 Youtz Ave
- 108 E Rosewood Ave
- 90 E Rosewood Ave
- 1861 Dallas Ave
- 118 E Rosewood Ave
- 81 Youtz Ave
- 86 E Rosewood Ave
- 88 Youtz Ave
- 124 E Rosewood Ave
- 82 E Rosewood Ave
- 77 Youtz Ave
- 1869 Dallas Ave
- 82 Youtz Ave
- 78 E Rosewood Ave