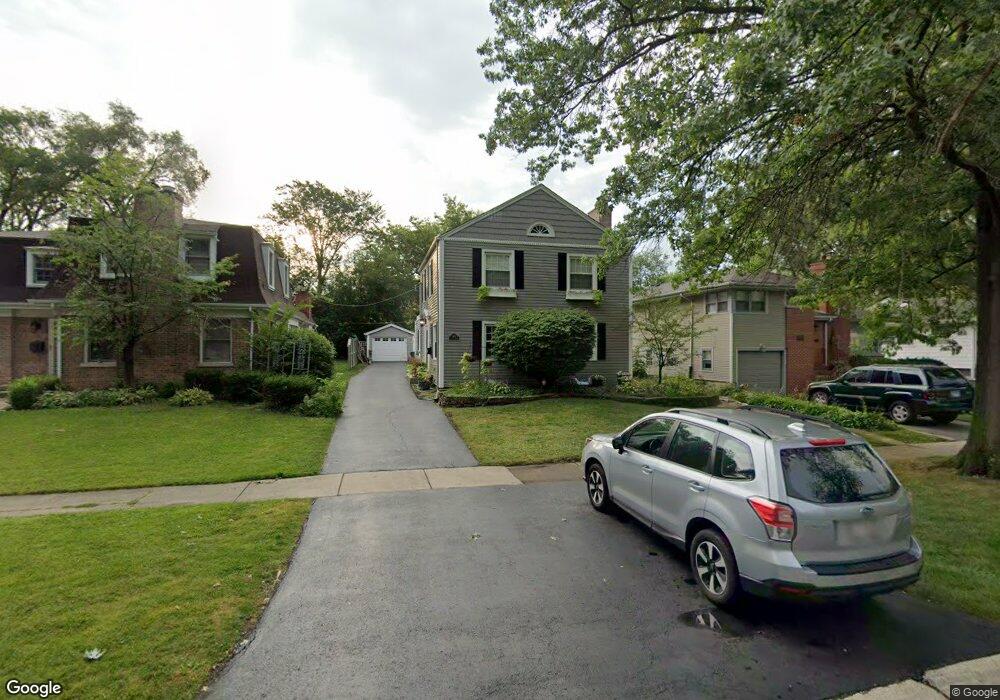
18433 Stewart Ave Homewood, IL 60430
Estimated Value: $273,000 - $311,000
4
Beds
3
Baths
1,897
Sq Ft
$156/Sq Ft
Est. Value
About This Home
This home is located at 18433 Stewart Ave, Homewood, IL 60430 and is currently estimated at $296,671, approximately $156 per square foot. 18433 Stewart Ave is a home located in Cook County with nearby schools including Western Avenue Elementary School, Parker Junior High School, and Homewood-Flossmoor High School.
Ownership History
Date
Name
Owned For
Owner Type
Purchase Details
Closed on
Jul 27, 2006
Sold by
Schoen Scott J and Schoen Erin M
Bought by
Green James P and Shannon Jennifer
Current Estimated Value
Home Financials for this Owner
Home Financials are based on the most recent Mortgage that was taken out on this home.
Original Mortgage
$222,400
Interest Rate
6.78%
Mortgage Type
Unknown
Purchase Details
Closed on
Oct 16, 2001
Sold by
Tanis Peter W and Tanis June J W
Bought by
Schoen Scott J and Schoen Erin M
Home Financials for this Owner
Home Financials are based on the most recent Mortgage that was taken out on this home.
Original Mortgage
$177,886
Interest Rate
6.72%
Mortgage Type
FHA
Purchase Details
Closed on
Mar 21, 1995
Sold by
Tanis June J W and Wagenhals June J
Bought by
Tanis Peter W and Tanis June J W
Create a Home Valuation Report for This Property
The Home Valuation Report is an in-depth analysis detailing your home's value as well as a comparison with similar homes in the area
Home Values in the Area
Average Home Value in this Area
Purchase History
| Date | Buyer | Sale Price | Title Company |
|---|---|---|---|
| Green James P | $278,000 | First American Title Ins Co | |
| Schoen Scott J | $180,500 | Lawyers Title Insurance Corp | |
| Tanis Peter W | -- | -- |
Source: Public Records
Mortgage History
| Date | Status | Borrower | Loan Amount |
|---|---|---|---|
| Previous Owner | Green James P | $222,400 | |
| Previous Owner | Schoen Scott J | $177,886 |
Source: Public Records
Tax History Compared to Growth
Tax History
| Year | Tax Paid | Tax Assessment Tax Assessment Total Assessment is a certain percentage of the fair market value that is determined by local assessors to be the total taxable value of land and additions on the property. | Land | Improvement |
|---|---|---|---|---|
| 2024 | $7,452 | $22,766 | $3,738 | $19,028 |
| 2023 | $4,990 | $22,766 | $3,738 | $19,028 |
| 2022 | $4,990 | $13,590 | $3,250 | $10,340 |
| 2021 | $5,035 | $13,589 | $3,250 | $10,339 |
| 2020 | $5,361 | $14,491 | $3,250 | $11,241 |
| 2019 | $6,440 | $16,489 | $2,925 | $13,564 |
| 2018 | $6,269 | $16,489 | $2,925 | $13,564 |
| 2017 | $6,184 | $16,489 | $2,925 | $13,564 |
| 2016 | $5,584 | $13,944 | $2,600 | $11,344 |
| 2015 | $5,538 | $13,944 | $2,600 | $11,344 |
| 2014 | $5,452 | $13,944 | $2,600 | $11,344 |
| 2013 | $5,603 | $15,393 | $2,600 | $12,793 |
Source: Public Records
Map
Nearby Homes
- 18330 Perth Ave
- 18509 Stedhall Rd
- 18418 Clyde Rd
- 18450 Stedhall Rd
- 2619 Alexander St
- 18314 Dundee Ave
- 18530 Stedhall Rd
- 625 Perth Ave
- 18210 Perth Ave
- 18400 Cherry Creek Dr Unit 105
- 18340 Cherry Creek Dr Unit 7
- 18157 Rockwell Ave
- 710 Bruce Ave
- 2807 Willow Rd Unit 103
- 802 Argyle Ave
- 18646 Palmer Cir
- 18461 Morris Ave
- 2055 183rd St
- 18051 Los Angeles Ave
- 18104 Park Ave
- 18437 Stewart Ave
- 18427 Stewart Ave
- 18449 Stewart Ave
- 18423 Stewart Ave
- 18432 Perth Ave
- 18438 Perth Ave
- 18426 Perth Ave
- 18419 Stewart Ave
- 18444 Perth Ave
- 18420 Perth Ave
- 18450 Perth Ave
- 18434 Stewart Ave
- 18415 Stewart Ave
- 18426 Stewart Ave
- 18436 Stewart Ave
- 18455 Stewart Ave
- 18414 Perth Ave
- 18424 Stewart Ave
- 18420 Stewart Ave
- 18446 Stewart Ave