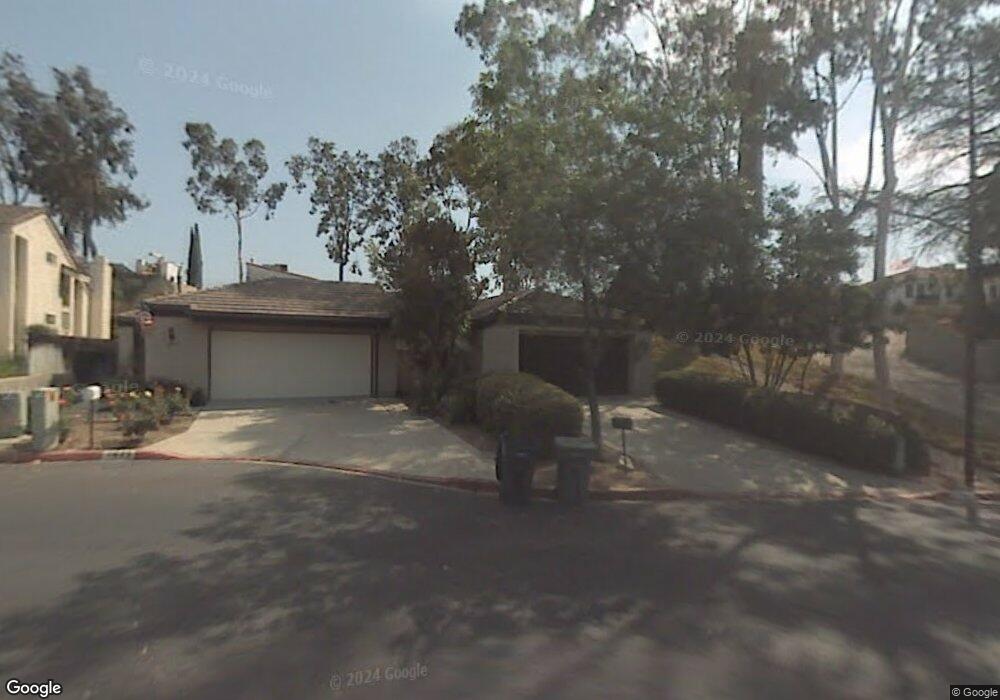
1844 Guilder Glen Escondido, CA 92029
Vineyard NeighborhoodEstimated Value: $708,642 - $750,000
2
Beds
2
Baths
1,347
Sq Ft
$548/Sq Ft
Est. Value
About This Home
This home is located at 1844 Guilder Glen, Escondido, CA 92029 and is currently estimated at $737,911, approximately $547 per square foot. 1844 Guilder Glen is a home located in San Diego County with nearby schools including Miller Elementary School, Del Dios Academy of Arts & Sciences, and Escondido High School.
Ownership History
Date
Name
Owned For
Owner Type
Purchase Details
Closed on
Mar 29, 2006
Sold by
Armstrong Trudy M
Bought by
Armstrong Trudy
Current Estimated Value
Purchase Details
Closed on
Jun 26, 2002
Sold by
Sturm Charles E and Sturm Barbara A
Bought by
Armstrong Trudy M
Home Financials for this Owner
Home Financials are based on the most recent Mortgage that was taken out on this home.
Original Mortgage
$196,800
Outstanding Balance
$83,309
Interest Rate
6.69%
Estimated Equity
$654,602
Purchase Details
Closed on
Jul 8, 1999
Sold by
Tobin Patrick T
Bought by
Sturm Charles E and Sturm Barbara A
Home Financials for this Owner
Home Financials are based on the most recent Mortgage that was taken out on this home.
Original Mortgage
$126,320
Interest Rate
7.7%
Purchase Details
Closed on
Jul 6, 1988
Create a Home Valuation Report for This Property
The Home Valuation Report is an in-depth analysis detailing your home's value as well as a comparison with similar homes in the area
Home Values in the Area
Average Home Value in this Area
Purchase History
| Date | Buyer | Sale Price | Title Company |
|---|---|---|---|
| Armstrong Trudy | -- | None Available | |
| Armstrong Trudy M | $246,000 | Chicago Title Co | |
| Sturm Charles E | $158,000 | California Title Company | |
| -- | $105,000 | -- |
Source: Public Records
Mortgage History
| Date | Status | Borrower | Loan Amount |
|---|---|---|---|
| Open | Armstrong Trudy M | $196,800 | |
| Previous Owner | Sturm Charles E | $126,320 | |
| Closed | Armstrong Trudy M | $24,600 |
Source: Public Records
Tax History Compared to Growth
Tax History
| Year | Tax Paid | Tax Assessment Tax Assessment Total Assessment is a certain percentage of the fair market value that is determined by local assessors to be the total taxable value of land and additions on the property. | Land | Improvement |
|---|---|---|---|---|
| 2025 | $3,934 | $356,273 | $131,251 | $225,022 |
| 2024 | $3,934 | $349,288 | $128,678 | $220,610 |
| 2023 | $3,844 | $342,440 | $126,155 | $216,285 |
| 2022 | $3,801 | $335,727 | $123,682 | $212,045 |
| 2021 | $3,738 | $329,145 | $121,257 | $207,888 |
| 2020 | $3,716 | $325,771 | $120,014 | $205,757 |
| 2019 | $3,625 | $319,384 | $117,661 | $201,723 |
| 2018 | $3,523 | $313,122 | $115,354 | $197,768 |
| 2017 | $3,465 | $306,984 | $113,093 | $193,891 |
| 2016 | $3,397 | $300,966 | $110,876 | $190,090 |
| 2015 | $3,367 | $296,446 | $109,211 | $187,235 |
| 2014 | $3,220 | $290,000 | $106,000 | $184,000 |
Source: Public Records
Map
Nearby Homes
- 1575 W Valley Pkwy Unit 25
- 1110 Gaucho Place
- 1225 Lancer Glen
- 1461 Autumn Woods Place
- 1001 S Hale Ave Unit 13
- 2243 Avenida Del Diablo
- 1756 Alhudson Dr
- 1045 Howard Ave
- 1007 Howard Ave Unit 42
- 2010 Palsero Ave
- 1750 W Citracado Pkwy Unit 157
- 1772 Crescent Knolls Glen
- 1630 Amanda Glen Ln
- 955 Howard Ave Unit 40
- 1640 Amanda Glen Ln
- 1729 Mesa Grande Rd
- 1390 Amanda Glen Ln N
- 1390 Amanda Ln
- 1369 W 11th Ave
- 1640 Amanda Ln
- 1846 Guilder Glen
- 1848 Guilder Glen
- 1850 Guilder Glen
- 1852 Guilder Glen
- 1847 Guilder Glen
- 1845 Guilder Glen
- 1849 Guilder Glen
- 1641 Lisbon Place
- 1820 Guilder Glen Unit 26
- 1854 Guilder Glen
- 1851 Guilder Glen
- 1853 Guilder Glen
- 1856 Guilder Glen
- 1639 Lisbon Place
- 1645 Lisbon Place
- 1855 Guilder Glen
- 1858 Guilder Glen
- 1857 Guilder Glen
- 1661 W 11th Ave
- 1636 Lisbon Place