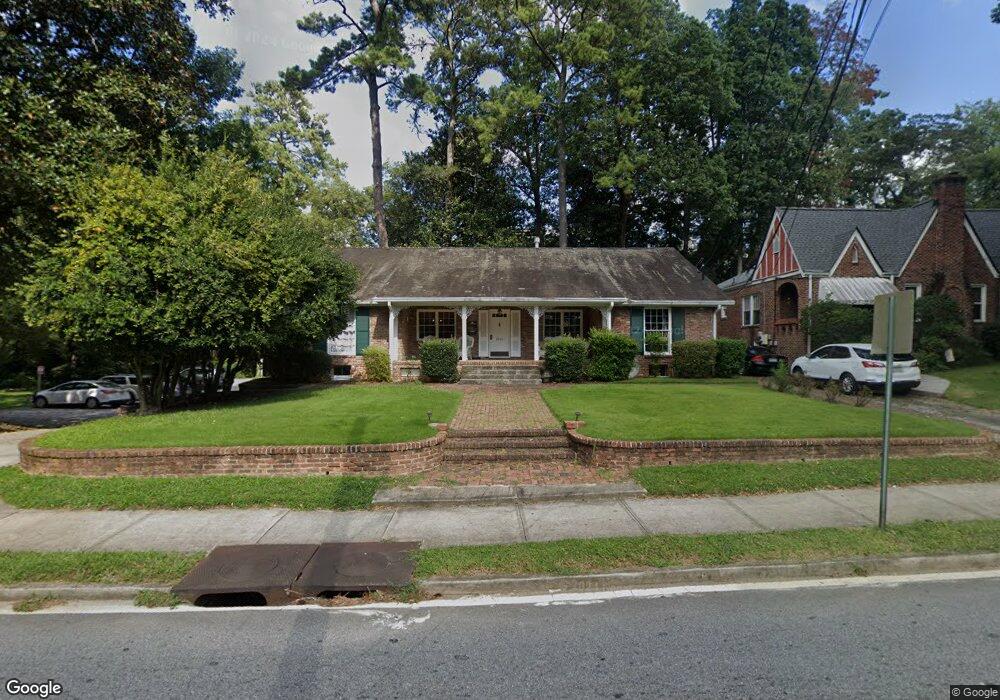
1845 Monroe Dr NE Unit . 6 Atlanta, GA 30324
Morningside NeighborhoodEstimated Value: $1,083,000 - $1,512,622
1
Bed
1
Bath
3,178
Sq Ft
$421/Sq Ft
Est. Value
About This Home
This home is located at 1845 Monroe Dr NE Unit . 6, Atlanta, GA 30324 and is currently estimated at $1,337,874, approximately $420 per square foot. 1845 Monroe Dr NE Unit . 6 is a home located in Fulton County with nearby schools including Morningside Elementary School, Midtown High School, and Carlisle Montessori School of Buckhead.
Ownership History
Date
Name
Owned For
Owner Type
Purchase Details
Closed on
Apr 7, 2017
Sold by
Puckett Arthur M
Bought by
Binns Witter Elizabeth
Current Estimated Value
Purchase Details
Closed on
Jun 14, 2002
Sold by
Delta Grp Inc
Bought by
Puckett Arthur M
Home Financials for this Owner
Home Financials are based on the most recent Mortgage that was taken out on this home.
Original Mortgage
$450,000
Interest Rate
6.77%
Mortgage Type
New Conventional
Purchase Details
Closed on
Jun 24, 1997
Sold by
The Delta Group Inc
Bought by
Hohenstein Louis and Hohenstein Anne
Home Financials for this Owner
Home Financials are based on the most recent Mortgage that was taken out on this home.
Original Mortgage
$214,600
Interest Rate
7.93%
Mortgage Type
New Conventional
Purchase Details
Closed on
Apr 5, 1996
Sold by
Allen Vicky E
Bought by
Ramsey Julian
Create a Home Valuation Report for This Property
The Home Valuation Report is an in-depth analysis detailing your home's value as well as a comparison with similar homes in the area
Home Values in the Area
Average Home Value in this Area
Purchase History
| Date | Buyer | Sale Price | Title Company |
|---|---|---|---|
| Binns Witter Elizabeth | $925,000 | -- | |
| Puckett Arthur M | $650,000 | -- | |
| Hohenstein Louis | $135,000 | -- | |
| The Delta Group Inc | $135,000 | -- | |
| Ramsey Julian | $248,500 | -- |
Source: Public Records
Mortgage History
| Date | Status | Borrower | Loan Amount |
|---|---|---|---|
| Previous Owner | Puckett Arthur M | $450,000 | |
| Previous Owner | The Delta Group Inc | $214,600 |
Source: Public Records
Tax History Compared to Growth
Tax History
| Year | Tax Paid | Tax Assessment Tax Assessment Total Assessment is a certain percentage of the fair market value that is determined by local assessors to be the total taxable value of land and additions on the property. | Land | Improvement |
|---|---|---|---|---|
| 2025 | $12,760 | $400,000 | $129,440 | $270,560 |
| 2023 | $12,760 | $414,000 | $129,440 | $284,560 |
| 2022 | $16,755 | $414,000 | $129,440 | $284,560 |
| 2021 | $17,676 | $401,880 | $125,640 | $276,240 |
| 2020 | $15,030 | $366,880 | $156,520 | $210,360 |
| 2019 | $1,398 | $360,400 | $153,760 | $206,640 |
| 2018 | $9,212 | $317,520 | $65,640 | $251,880 |
| 2017 | $9,611 | $222,520 | $45,960 | $176,560 |
| 2016 | $9,635 | $222,520 | $45,960 | $176,560 |
| 2015 | $11,059 | $222,520 | $45,960 | $176,560 |
| 2014 | $10,089 | $222,520 | $45,960 | $176,560 |
Source: Public Records
Map
Nearby Homes
- 1835 Rock Springs Ln NE
- 1761 Monroe Dr NE
- 502 Ansley Villa Dr NE
- 534 Allen Rd NE
- 1705 Monroe Dr NE Unit C05
- 1705 Monroe Dr NE Unit B4
- 1803 White Oak Hollow NE
- 219 Little John Trail NE
- 1822 N Rock Springs Rd NE Unit 24
- 1779 Beckham Place NE
- 1821 N Rock Springs Rd NE
- 388 Beverly Rd NE
- 1845 Windemere Dr NE
- 621 E Morningside Dr NE
- 1740 Doncaster Dr NE
- 18 Polo Dr NE
- 1845 Monroe Dr NE Unit 4
- 1845 Monroe Dr NE Unit 3
- 1845 Monroe Dr NE Unit 2
- 1845 Monroe Dr NE Unit B
- 1845 Monroe Dr NE Unit . 1
- 1845 Monroe Dr NE
- 1839 Monroe Dr NE
- 1835 Monroe Dr NE
- 1834 Rockridge Place NE
- 1829 Monroe Dr NE
- 1831 Monroe Dr NE
- 1836 Rockridge Place NE
- 1848 Monroe Dr NE
- 1842 Monroe Dr NE
- 1832 Rockridge Place NE
- 1854 Monroe Dr NE
- 1838 Monroe Dr NE
- 1830 Rockridge Place NE
- 1846 Monroe Dr NE
- 1823 Monroe Dr NE