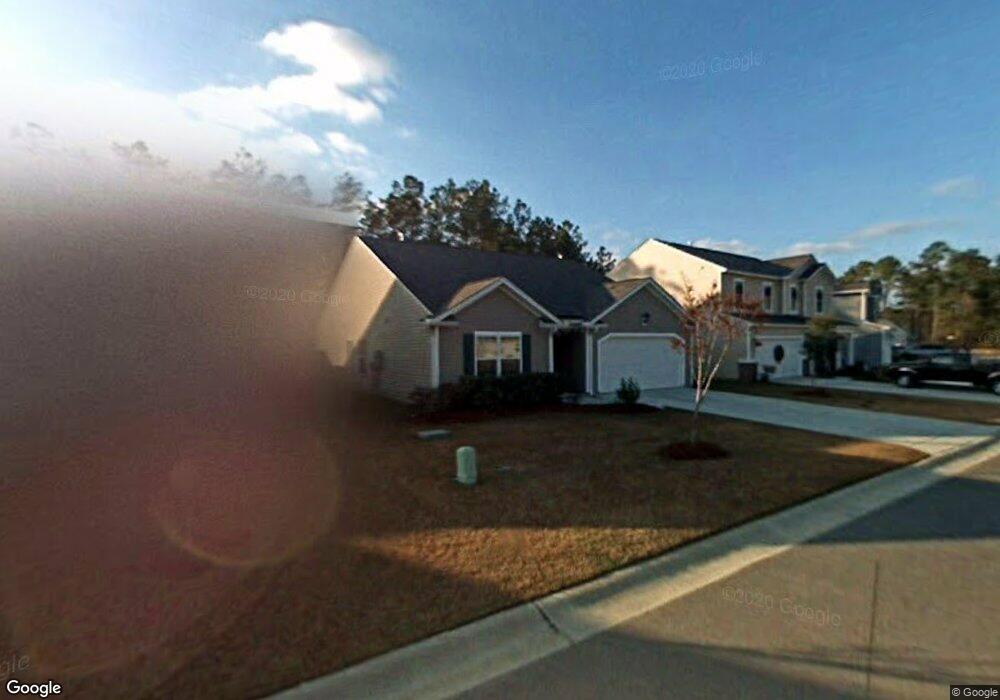
185 Sweet Alyssum Dr Ladson, SC 29456
Estimated Value: $338,763 - $370,000
3
Beds
2
Baths
1,660
Sq Ft
$212/Sq Ft
Est. Value
About This Home
This home is located at 185 Sweet Alyssum Dr, Ladson, SC 29456 and is currently estimated at $352,441, approximately $212 per square foot. 185 Sweet Alyssum Dr is a home with nearby schools including Dr. Eugene Sires Elementary, Oakbrook Middle School, and Ashley Ridge High School.
Ownership History
Date
Name
Owned For
Owner Type
Purchase Details
Closed on
Sep 4, 2020
Sold by
Chioffe Harry R and Chioffe Henry R
Bought by
Chioffe Henry R
Current Estimated Value
Home Financials for this Owner
Home Financials are based on the most recent Mortgage that was taken out on this home.
Original Mortgage
$125,147
Outstanding Balance
$111,014
Interest Rate
3%
Mortgage Type
New Conventional
Estimated Equity
$241,427
Purchase Details
Closed on
Dec 6, 2005
Sold by
The Ryland Group Inc
Bought by
Chioffe Harry R
Home Financials for this Owner
Home Financials are based on the most recent Mortgage that was taken out on this home.
Original Mortgage
$161,357
Interest Rate
6.1%
Mortgage Type
New Conventional
Purchase Details
Closed on
May 11, 2005
Sold by
Gramling Brothers Real Estate & Developm
Bought by
The Ryland Group Inc
Create a Home Valuation Report for This Property
The Home Valuation Report is an in-depth analysis detailing your home's value as well as a comparison with similar homes in the area
Home Values in the Area
Average Home Value in this Area
Purchase History
| Date | Buyer | Sale Price | Title Company |
|---|---|---|---|
| Chioffe Henry R | -- | None Available | |
| Chioffe Harry R | $179,286 | -- | |
| The Ryland Group Inc | $2,848,500 | -- |
Source: Public Records
Mortgage History
| Date | Status | Borrower | Loan Amount |
|---|---|---|---|
| Open | Chioffe Henry R | $125,147 | |
| Closed | Chioffe Harry R | $161,357 |
Source: Public Records
Tax History Compared to Growth
Tax History
| Year | Tax Paid | Tax Assessment Tax Assessment Total Assessment is a certain percentage of the fair market value that is determined by local assessors to be the total taxable value of land and additions on the property. | Land | Improvement |
|---|---|---|---|---|
| 2025 | $2,059 | $13,046 | $3,800 | $9,246 |
| 2024 | $2,059 | $13,046 | $3,800 | $9,246 |
| 2023 | $2,059 | $7,613 | $1,600 | $6,013 |
| 2022 | $1,680 | $7,040 | $1,610 | $5,430 |
| 2021 | $4,542 | $7,040 | $1,610 | $5,430 |
| 2020 | $1,646 | $6,120 | $1,400 | $4,720 |
| 2019 | $1,607 | $6,120 | $1,400 | $4,720 |
| 2018 | $1,423 | $6,120 | $1,400 | $4,720 |
| 2017 | $1,396 | $6,120 | $1,400 | $4,720 |
| 2016 | $1,378 | $6,120 | $1,400 | $4,720 |
| 2015 | $1,380 | $6,120 | $1,400 | $4,720 |
| 2014 | $1,506 | $172,700 | $0 | $0 |
| 2013 | -- | $6,910 | $0 | $0 |
Source: Public Records
Map
Nearby Homes
- 4493 Outwood Dr
- 714 Alwyn Blvd
- 137 Brown Swiss Cir
- 4529 Outwood Dr
- 148 Brown Swiss Cir
- 146 Brown Swiss Cir
- 139 Brown Swiss Cir
- 143 Brown Swiss Cir
- 149 Brown Swiss Cir
- 145 Brown Swiss Cir
- 160 Casein St
- 4439 Kindlewood Dr
- 4504 Logwood Dr
- 136 Caleb Ct
- 101 Caleb Ct
- 317 Breckingridge Dr
- 105 Salem Rd
- 4553 Waddling Way
- 215 Breckingridge Dr
- 4450 Hardwood St
- 183 Sweet Alyssum Dr
- 187 Sweet Alyssum Dr
- 181 Sweet Alyssum Dr
- 189 Sweet Alyssum Dr
- 200 Sweet Alyssum Dr
- 192 Sweet Alyssum Dr
- 179 Sweet Alyssum Dr
- 177 Sweet Alyssum Dr
- 205 Sweet Alyssum Dr
- 190 Sweet Alyssum Dr
- 303 Sweet Alyssum Dr
- 298 Sweet Alyssum Dr
- 204 Sweet Alyssum Dr
- 188 Sweet Alyssum Dr
- 175 Sweet Alyssum Dr
- 207 Sweet Alyssum Dr
- 186 Sweet Alyssum Dr
- 206 Sweet Alyssum Dr
- 301 Sweet Alyssum Dr
- 296 Sweet Alyssum Dr