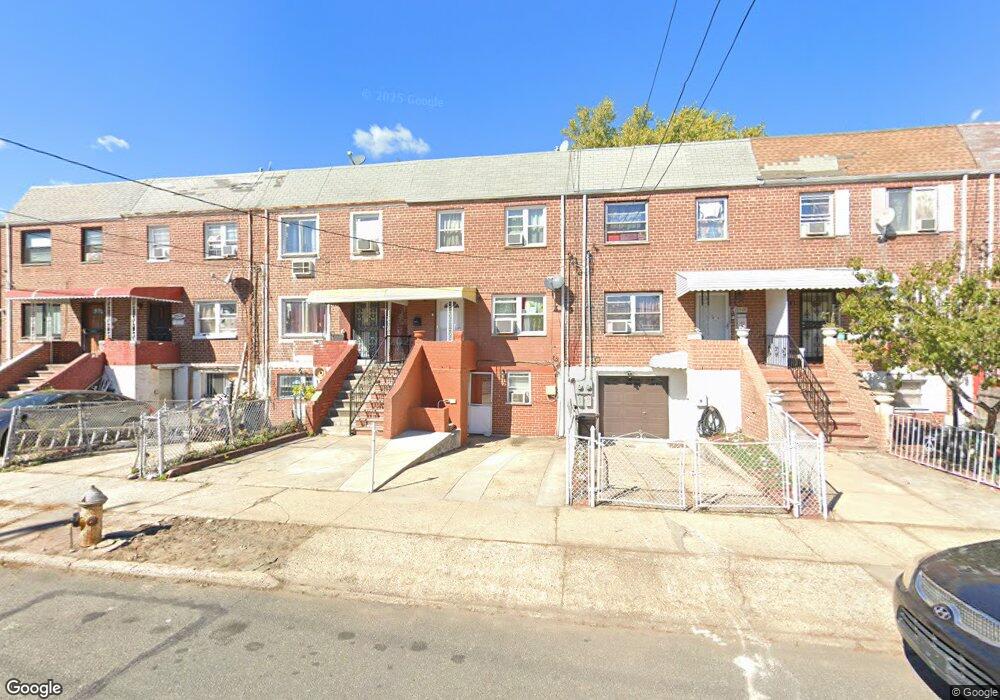
18505 Henderson Ave Hollis, NY 11423
Hollis NeighborhoodEstimated Value: $657,000 - $748,000
3
Beds
2
Baths
1,683
Sq Ft
$425/Sq Ft
Est. Value
About This Home
This home is located at 18505 Henderson Ave, Hollis, NY 11423 and is currently estimated at $715,091, approximately $424 per square foot. 18505 Henderson Ave is a home located in Queens County with nearby schools including P.S. 118 Lorraine Hansberry, I.S. 192 The Linden, and Wellspring Elementary & Middle.
Ownership History
Date
Name
Owned For
Owner Type
Purchase Details
Closed on
Nov 1, 2024
Sold by
Evans Sharon
Bought by
185-05 Henderson Avenue Llc
Current Estimated Value
Purchase Details
Closed on
Apr 12, 2016
Sold by
Cooper Nefatari
Bought by
Evans Sharon
Purchase Details
Closed on
Jan 19, 2007
Sold by
Evans Sharon
Bought by
Cooper Nefatari
Purchase Details
Closed on
Aug 17, 2006
Sold by
Shaw Charmaine
Bought by
Evans Sharon
Home Financials for this Owner
Home Financials are based on the most recent Mortgage that was taken out on this home.
Original Mortgage
$276,000
Interest Rate
6.83%
Mortgage Type
Purchase Money Mortgage
Purchase Details
Closed on
Sep 4, 2003
Sold by
Rudd Andree C
Bought by
Shaw Charmaine
Home Financials for this Owner
Home Financials are based on the most recent Mortgage that was taken out on this home.
Original Mortgage
$175,750
Interest Rate
5.86%
Mortgage Type
Purchase Money Mortgage
Create a Home Valuation Report for This Property
The Home Valuation Report is an in-depth analysis detailing your home's value as well as a comparison with similar homes in the area
Home Values in the Area
Average Home Value in this Area
Purchase History
| Date | Buyer | Sale Price | Title Company |
|---|---|---|---|
| 185-05 Henderson Avenue Llc | $346,000 | -- | |
| Evans Sharon | -- | -- | |
| Evans Sharon | -- | -- | |
| Cooper Nefatari | -- | -- | |
| Cooper Nefatari | -- | -- | |
| Evans Sharon | $345,000 | -- | |
| Evans Sharon | $345,000 | -- | |
| Shaw Charmaine | $185,000 | -- | |
| Shaw Charmaine | $185,000 | -- |
Source: Public Records
Mortgage History
| Date | Status | Borrower | Loan Amount |
|---|---|---|---|
| Previous Owner | Evans Sharon | $276,000 | |
| Previous Owner | Shaw Charmaine | $175,750 |
Source: Public Records
Tax History Compared to Growth
Tax History
| Year | Tax Paid | Tax Assessment Tax Assessment Total Assessment is a certain percentage of the fair market value that is determined by local assessors to be the total taxable value of land and additions on the property. | Land | Improvement |
|---|---|---|---|---|
| 2025 | $5,432 | $27,229 | $7,700 | $19,529 |
| 2024 | $5,432 | $27,043 | $7,684 | $19,359 |
| 2023 | $5,212 | $25,949 | $7,326 | $18,623 |
| 2022 | $4,887 | $31,920 | $10,740 | $21,180 |
| 2021 | $4,985 | $31,680 | $10,740 | $20,940 |
| 2020 | $4,803 | $28,200 | $10,740 | $17,460 |
| 2019 | $4,714 | $24,960 | $10,740 | $14,220 |
| 2018 | $4,408 | $21,624 | $10,663 | $10,961 |
| 2017 | $4,159 | $20,400 | $10,740 | $9,660 |
| 2016 | $3,946 | $20,400 | $10,740 | $9,660 |
| 2015 | $2,378 | $18,909 | $10,225 | $8,684 |
| 2014 | $2,378 | $18,780 | $11,940 | $6,840 |
Source: Public Records
Map
Nearby Homes
- 184-15 Henderson Ave
- 185-05 Henderson Ave
- 102-13 183rd Place
- 10211 187th St
- 102-35 187th St
- 184-09 Jamaica Ave
- 10220 189th St
- 90-45 186th St
- 188-14 Woodhull Ave
- 90-31 185th St
- 188-09 Jamaica Ave
- 90-21 185th St
- 90-19 185th St
- 104-11 188th St
- 181-18 93rd Ave
- 91-28 182nd Place
- 183-67 Dunlop Ave
- 190-30 103rd Ave
- 91-19 182nd St
- 8931 184th St
- 18505 Henderson Ave
- 18503 Henderson Ave
- 18507 Henderson Ave
- 18501 Henderson Ave
- 184-17 Henderson Ave
- 18509 Henderson Ave
- 18511 Henderson Ave
- 18425 Henderson Ave
- 18515 Henderson Ave
- 18423 Henderson Ave
- 18517 Henderson Ave
- 184-23 Henderson Ave
- 18421 Henderson Ave
- 18519 Henderson Ave
- 18419 Henderson Ave
- 10201 185th St
- 18521 Henderson Ave
- 18417 Henderson Ave
- 18460 Henderson Ave
- 18415 Henderson Ave