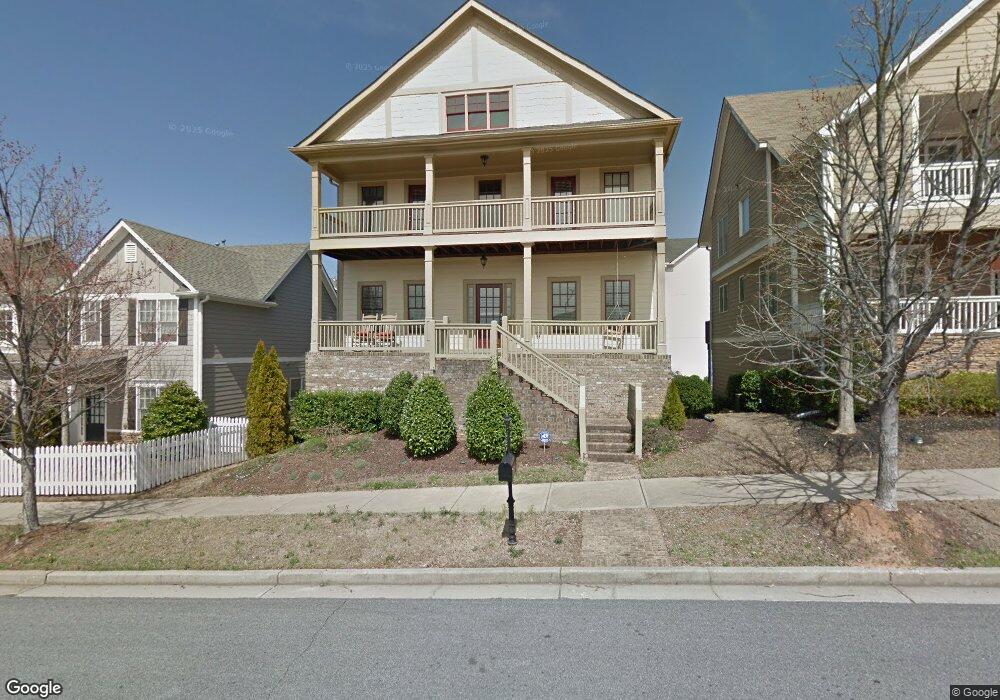
1854 Stanfield Ave NW Atlanta, GA 30318
West Highlands NeighborhoodEstimated Value: $604,866 - $664,000
3
Beds
3
Baths
2,620
Sq Ft
$240/Sq Ft
Est. Value
About This Home
This home is located at 1854 Stanfield Ave NW, Atlanta, GA 30318 and is currently estimated at $627,717, approximately $239 per square foot. 1854 Stanfield Ave NW is a home located in Fulton County with nearby schools including Boyd Elementary School, John Lewis Invictus Academy, and Frederick Douglass High School.
Ownership History
Date
Name
Owned For
Owner Type
Purchase Details
Closed on
May 29, 2013
Sold by
Etheridge James E
Bought by
Etheridge James E and Etheridge Nicole Irene
Current Estimated Value
Home Financials for this Owner
Home Financials are based on the most recent Mortgage that was taken out on this home.
Original Mortgage
$279,380
Outstanding Balance
$197,669
Interest Rate
3.37%
Mortgage Type
VA
Estimated Equity
$430,048
Purchase Details
Closed on
May 24, 2010
Sold by
Roller Ernest K
Bought by
Quarshie Perrin
Home Financials for this Owner
Home Financials are based on the most recent Mortgage that was taken out on this home.
Original Mortgage
$248,651
Interest Rate
4.87%
Mortgage Type
FHA
Purchase Details
Closed on
Mar 28, 2005
Sold by
Brock Built Llc
Bought by
Roller Ernest K
Home Financials for this Owner
Home Financials are based on the most recent Mortgage that was taken out on this home.
Original Mortgage
$251,650
Interest Rate
5.88%
Mortgage Type
New Conventional
Create a Home Valuation Report for This Property
The Home Valuation Report is an in-depth analysis detailing your home's value as well as a comparison with similar homes in the area
Home Values in the Area
Average Home Value in this Area
Purchase History
| Date | Buyer | Sale Price | Title Company |
|---|---|---|---|
| Etheridge James E | -- | -- | |
| Etheridge James E | $275,500 | -- | |
| Quarshie Perrin | $252,000 | -- | |
| Roller Ernest K | $314,600 | -- |
Source: Public Records
Mortgage History
| Date | Status | Borrower | Loan Amount |
|---|---|---|---|
| Open | Etheridge James E | $279,380 | |
| Closed | Etheridge James E | $279,380 | |
| Previous Owner | Quarshie Perrin | $248,651 | |
| Previous Owner | Roller Ernest K | $251,650 |
Source: Public Records
Tax History Compared to Growth
Tax History
| Year | Tax Paid | Tax Assessment Tax Assessment Total Assessment is a certain percentage of the fair market value that is determined by local assessors to be the total taxable value of land and additions on the property. | Land | Improvement |
|---|---|---|---|---|
| 2025 | $5,162 | $231,120 | $86,280 | $144,840 |
| 2023 | $10,042 | $242,560 | $78,240 | $164,320 |
| 2022 | $4,942 | $206,080 | $59,280 | $146,800 |
| 2021 | $4,445 | $185,480 | $49,200 | $136,280 |
| 2020 | $4,212 | $175,280 | $38,720 | $136,560 |
| 2019 | $486 | $172,200 | $38,040 | $134,160 |
| 2018 | $4,509 | $151,400 | $42,720 | $108,680 |
| 2017 | $3,998 | $92,560 | $21,720 | $70,840 |
| 2016 | $4,008 | $92,560 | $21,720 | $70,840 |
| 2015 | $4,490 | $92,560 | $21,720 | $70,840 |
| 2014 | $3,457 | $76,240 | $17,280 | $58,960 |
Source: Public Records
Map
Nearby Homes
- 989 Bibbs Cir NW Unit 25
- 965 Samples Ln NW
- 1784 Hollingsworth Blvd NW
- 1990 Drew Dr
- 2818 Georgia Aster Way Unit 9
- 1394 Sweethshrub Place Unit 29
- 1954 Sanford Dr
- Lindsay Plan at West Highlands
- Laurel Plan at West Highlands
- Middleton Plan at West Highlands
- 1739 Drew Dr
- 879 Samples Ln NW
- 1744 Habershal Dr NW
- 1976 Boyd Trace Ln NW
- 1947 Drew Dr
- 1977 Stanfield Ave
- 887 Proctor Oaks St NW
- 1799 Willow Way NW
- 1852 Stanfield Ave NW
- 970 W Highland Dr NW
- 970 West Highland Dr NW
- 1858 Stanfield Ave NW
- 973 Arthur Ln NW
- 972 West Highland Dr NW
- 975 Arthur Ln NW
- W W Highland Dr NW
- 1856 Perry Blvd NW
- 1854 Perry Blvd NW
- 0 Arthur Ln NW Unit 8757054
- 0 Arthur Ln NW Unit 8062287
- 0 Arthur Ln NW Unit 8678635
- 1872 Standfield Ave Unit 7
- 1872 Stanfield Ave NW Unit 7
- 1872 Stanfield Ave NW
- 1860 Perry Blvd NW
- 966 Arthur Ln NW
- 1874 Stanfield Ave NW