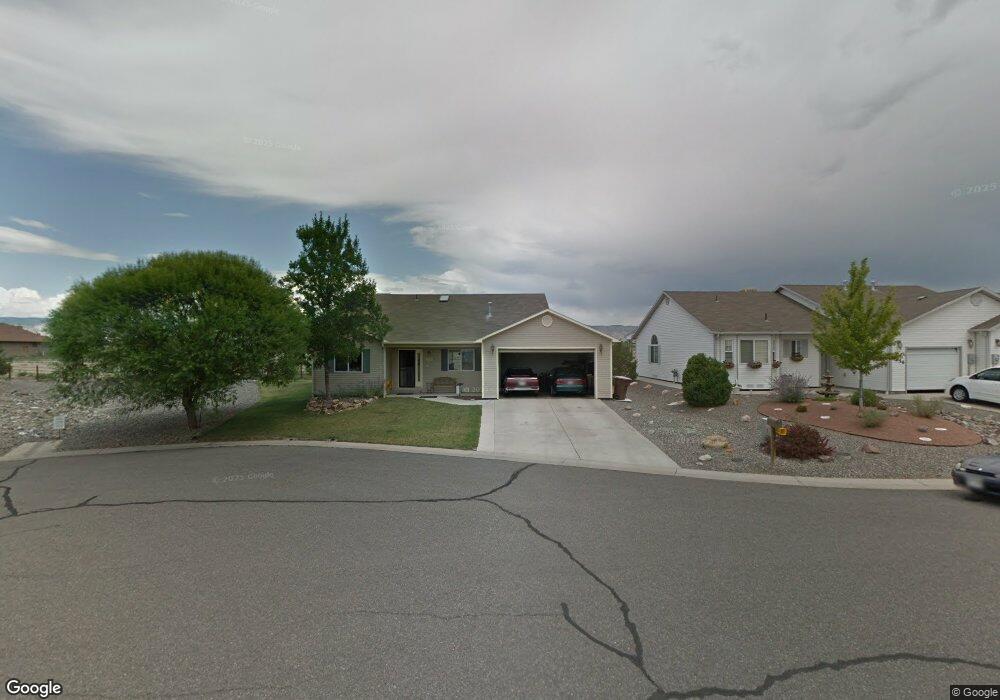
1858 Sneffles St Montrose, CO 81401
Estimated Value: $397,000 - $463,553
3
Beds
2
Baths
1,752
Sq Ft
$247/Sq Ft
Est. Value
About This Home
This home is located at 1858 Sneffles St, Montrose, CO 81401 and is currently estimated at $433,388, approximately $247 per square foot. 1858 Sneffles St is a home located in Montrose County with nearby schools including Cottonwood Elementary School, Columbine Middle School, and Montrose High School.
Ownership History
Date
Name
Owned For
Owner Type
Purchase Details
Closed on
Jul 25, 2011
Sold by
Nocas Matthew I and Nocas Lea
Bought by
Hutson John R
Current Estimated Value
Purchase Details
Closed on
Jan 31, 2005
Sold by
Real Homes Solutions Llc
Bought by
Nocas Matthew I and Nocas Lea
Home Financials for this Owner
Home Financials are based on the most recent Mortgage that was taken out on this home.
Original Mortgage
$136,000
Interest Rate
5.8%
Mortgage Type
New Conventional
Purchase Details
Closed on
Dec 29, 2004
Sold by
Manig Mark H
Bought by
Manig Michelle L
Home Financials for this Owner
Home Financials are based on the most recent Mortgage that was taken out on this home.
Original Mortgage
$136,000
Interest Rate
5.8%
Mortgage Type
New Conventional
Purchase Details
Closed on
Jul 10, 2002
Sold by
Burk Stacy W
Bought by
Manig Mark H and Manig Michelle L
Purchase Details
Closed on
Sep 25, 1998
Sold by
Highlife Homes Of Montrose
Bought by
Burk Stacy W
Create a Home Valuation Report for This Property
The Home Valuation Report is an in-depth analysis detailing your home's value as well as a comparison with similar homes in the area
Home Values in the Area
Average Home Value in this Area
Purchase History
| Date | Buyer | Sale Price | Title Company |
|---|---|---|---|
| Hutson John R | $162,500 | Land Title Guaranty Company | |
| Nocas Matthew I | $170,000 | Security Title | |
| Manig Michelle L | $6,500 | -- | |
| Real Home Solutions Llc | $6,500 | Security Title | |
| Manig Michelle L | -- | Security Title | |
| Manig Mark H | $175,000 | -- | |
| Burk Stacy W | $123,300 | -- |
Source: Public Records
Mortgage History
| Date | Status | Borrower | Loan Amount |
|---|---|---|---|
| Previous Owner | Nocas Matthew I | $136,000 |
Source: Public Records
Tax History Compared to Growth
Tax History
| Year | Tax Paid | Tax Assessment Tax Assessment Total Assessment is a certain percentage of the fair market value that is determined by local assessors to be the total taxable value of land and additions on the property. | Land | Improvement |
|---|---|---|---|---|
| 2024 | $1,793 | $24,880 | $3,210 | $21,670 |
| 2023 | $1,793 | $29,620 | $3,820 | $25,800 |
| 2022 | $1,415 | $20,280 | $2,780 | $17,500 |
| 2021 | $1,458 | $20,860 | $2,860 | $18,000 |
| 2020 | $1,226 | $18,040 | $2,470 | $15,570 |
| 2019 | $1,234 | $18,040 | $2,470 | $15,570 |
| 2018 | $930 | $13,240 | $1,990 | $11,250 |
| 2017 | $922 | $13,240 | $1,990 | $11,250 |
| 2016 | $960 | $14,010 | $2,010 | $12,000 |
| 2015 | $943 | $14,010 | $2,010 | $12,000 |
| 2014 | $790 | $12,550 | $2,010 | $10,540 |
Source: Public Records
Map
Nearby Homes
- 1951 Dubonnet Ct
- 1686 Rheims Ct
- 2707 Abrams Ave
- 1691 Rheims Ct
- Lot 2403 Fellows Dr
- Lot 2305 Painted Wall Ln
- TBD Odelle Rd
- 1649 Sneffels St
- 2820 Glacier Dr
- TBD Sleeping Bear Rd
- 1649 Hermosa St
- 2669 Lone Cone Ave
- 1600 Arland Rd Unit 3
- 2802 Glacier Dr
- Lot 2003 Torrence Dr
- TBD Torrence Dr
- 0 E Oak Grove Rd
- Tract A & 3 E Oak Grove Rd
- Tract 3 E Oak Grove Rd
- Tract A, 3 Lot2 E Oak Grove Rd
- 1856 Sneffles St
- 2532 Bear Lake Dr
- 2600 Bear Lake Dr
- 1854 Sneffles St
- Lot 2611 Bear Lake Dr
- 2618 Bear Lake Dr
- 1862 Sneffles St
- 2602 Bear Lake Dr
- 2524 Bear Lake Dr
- 2424 Bear Lake Dr
- 1864 Sneffles St
- 1865 Sneffels St
- 1852 Sneffles St
- 1865 Sneffles St
- 1857 Sneffels St
- 1857 Sneffles St
- 1956 Sneffels St
- 2603 Bear Lake Dr
- 1956 Sneffles St
- 0 Dubonnet Ct