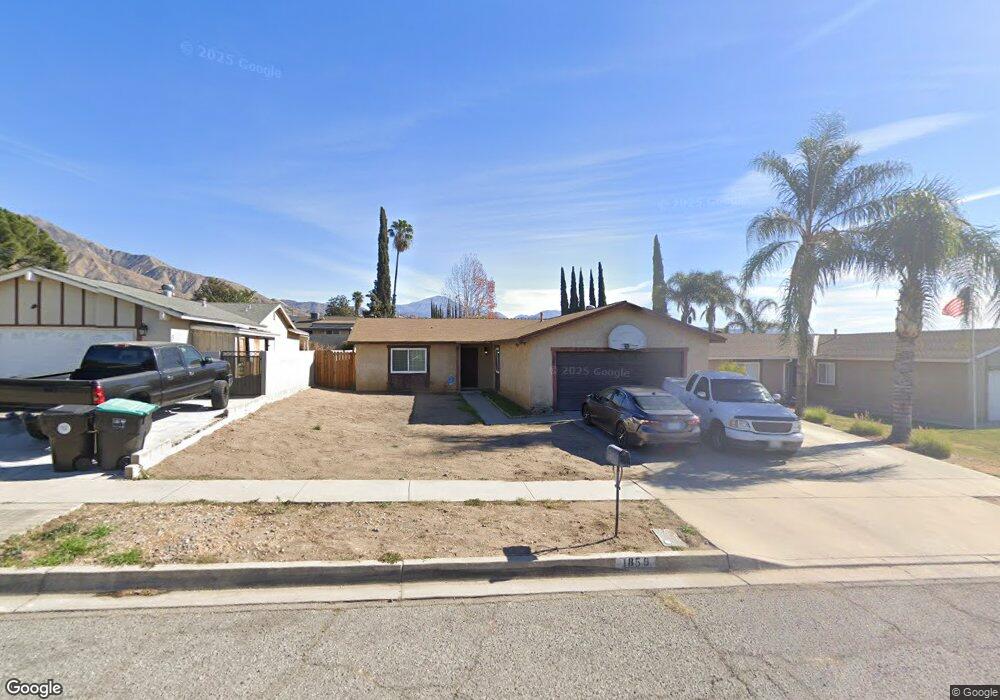
1859 Church Ave Highland, CA 92346
Crossroads NeighborhoodEstimated Value: $466,000 - $581,000
3
Beds
2
Baths
1,644
Sq Ft
$318/Sq Ft
Est. Value
About This Home
This home is located at 1859 Church Ave, Highland, CA 92346 and is currently estimated at $522,585, approximately $317 per square foot. 1859 Church Ave is a home located in San Bernardino County with nearby schools including Highland Pacific Elementary School, Serrano Middle School, and San Gorgonio High School.
Ownership History
Date
Name
Owned For
Owner Type
Purchase Details
Closed on
May 7, 2001
Sold by
Finn Stephanie M
Bought by
Tullis Andrew F
Current Estimated Value
Home Financials for this Owner
Home Financials are based on the most recent Mortgage that was taken out on this home.
Original Mortgage
$132,914
Interest Rate
7.14%
Mortgage Type
FHA
Purchase Details
Closed on
Apr 25, 2001
Sold by
Tullis Andrew F
Bought by
Lewis William D and Lewis Victoria D
Home Financials for this Owner
Home Financials are based on the most recent Mortgage that was taken out on this home.
Original Mortgage
$132,914
Interest Rate
7.14%
Mortgage Type
FHA
Purchase Details
Closed on
Mar 19, 1998
Sold by
Eatinger William M and Eatinger Ursula A
Bought by
Tullis Andrew F
Home Financials for this Owner
Home Financials are based on the most recent Mortgage that was taken out on this home.
Original Mortgage
$101,726
Interest Rate
7.06%
Mortgage Type
FHA
Create a Home Valuation Report for This Property
The Home Valuation Report is an in-depth analysis detailing your home's value as well as a comparison with similar homes in the area
Home Values in the Area
Average Home Value in this Area
Purchase History
| Date | Buyer | Sale Price | Title Company |
|---|---|---|---|
| Tullis Andrew F | -- | Chicago Title Co | |
| Lewis William D | $135,000 | Chicago Title Co | |
| Tullis Andrew F | $102,000 | United Title |
Source: Public Records
Mortgage History
| Date | Status | Borrower | Loan Amount |
|---|---|---|---|
| Previous Owner | Lewis William D | $132,914 | |
| Previous Owner | Tullis Andrew F | $101,726 | |
| Closed | Lewis William D | $4,050 |
Source: Public Records
Tax History Compared to Growth
Tax History
| Year | Tax Paid | Tax Assessment Tax Assessment Total Assessment is a certain percentage of the fair market value that is determined by local assessors to be the total taxable value of land and additions on the property. | Land | Improvement |
|---|---|---|---|---|
| 2025 | $2,657 | $203,426 | $50,856 | $152,570 |
| 2024 | $2,657 | $199,437 | $49,859 | $149,578 |
| 2023 | $2,590 | $195,526 | $48,881 | $146,645 |
| 2022 | $2,593 | $191,693 | $47,923 | $143,770 |
| 2021 | $2,596 | $187,934 | $46,983 | $140,951 |
| 2020 | $2,601 | $186,007 | $46,501 | $139,506 |
| 2019 | $2,526 | $182,360 | $45,589 | $136,771 |
| 2018 | $2,498 | $178,784 | $44,695 | $134,089 |
| 2017 | $2,421 | $175,279 | $43,819 | $131,460 |
| 2016 | $2,349 | $171,842 | $42,960 | $128,882 |
| 2015 | $2,242 | $169,261 | $42,315 | $126,946 |
| 2014 | $2,179 | $165,945 | $41,486 | $124,459 |
Source: Public Records
Map
Nearby Homes
- 27600 Atlantic Ave Unit 427
- 3850 Atlantic Ave Unit 58
- 3850 Atlantic Ave Unit 217
- 3850 Atlantic Ave Unit 275
- 3850 Atlantic Ave Unit 296
- 3850 Atlantic Ave Unit 257
- 3850 Atlantic Ave Unit 27
- 3850 Atlantic Ave Unit 274
- 3850 Atlantic Ave Unit 60
- 3850 Atlantic Ave Unit 151
- 3850 Atlantic Ave Unit 80
- 3850 Atlantic Ave Unit 291
- 3850 Atlantic Ave Unit 199
- 27471 Main St
- 6986 Church Ave
- 6941 La Praix St
- 0 La Praix St
- 2035 Reedy Ave
- 7001 Church Ave Unit 5
- 3531 Rainbow Ln
- 1841 Church Ave
- 1877 Church Ave
- 1868 Buckeye Ct
- 1895 Church Ave
- 1823 Church Ave
- 1882 Buckeye Ct
- 1856 Buckeye Ct
- 1894 Buckeye Ct
- 1842 Buckeye Ct
- 3855 Atlantic Ave
- 1877 Buckeye Ct
- 1841 Buckeye Ct
- 1859 Buckeye Ct
- 3796 Atlantic Ave
- 1876 Cienega Ct
- 1858 Cienega Ct
- 3875 Atlantic Ave
- 1841 Cienega Ct
- 3895 Atlantic Ave
- 1859 Cienega Ct