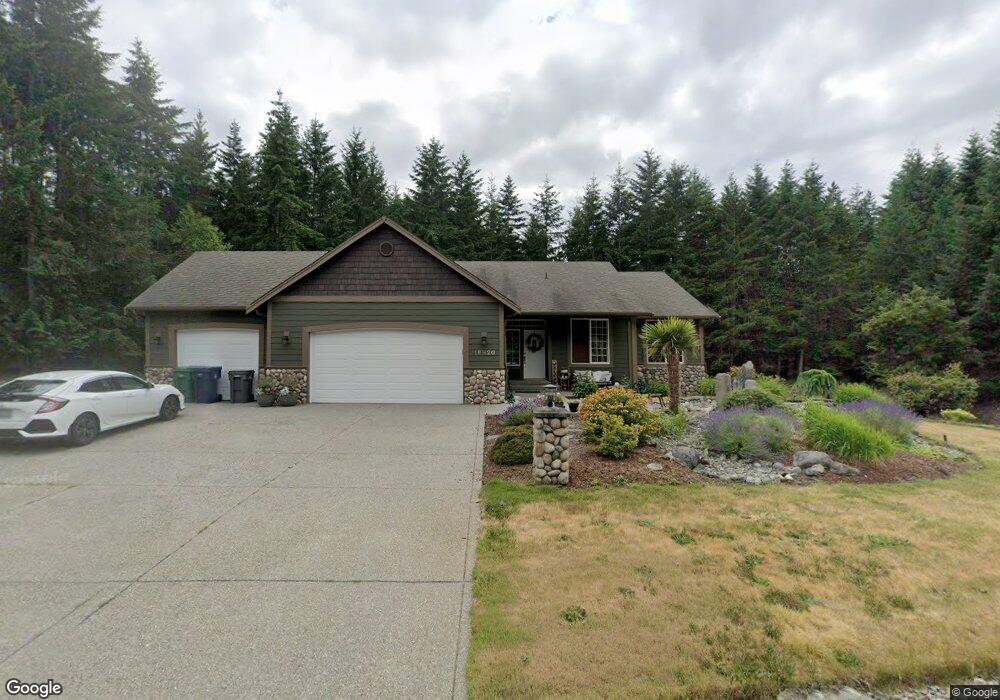
18620 64th Ave NW Stanwood, WA 98292
Estimated Value: $815,543 - $961,000
3
Beds
3
Baths
1,646
Sq Ft
$520/Sq Ft
Est. Value
About This Home
This home is located at 18620 64th Ave NW, Stanwood, WA 98292 and is currently estimated at $855,886, approximately $519 per square foot. 18620 64th Ave NW is a home located in Snohomish County with nearby schools including Stanwood Elementary School, Port Susan Middle School, and Stanwood High School.
Ownership History
Date
Name
Owned For
Owner Type
Purchase Details
Closed on
Jan 12, 2006
Sold by
Northview Custom Homes Inc
Bought by
Howe Michael K and Howe Monica E
Current Estimated Value
Home Financials for this Owner
Home Financials are based on the most recent Mortgage that was taken out on this home.
Original Mortgage
$307,590
Outstanding Balance
$168,769
Interest Rate
5.87%
Mortgage Type
Fannie Mae Freddie Mac
Estimated Equity
$687,117
Purchase Details
Closed on
Nov 22, 2004
Sold by
Blacktail Forest Llc
Bought by
Northview Custom Homes Inc
Home Financials for this Owner
Home Financials are based on the most recent Mortgage that was taken out on this home.
Original Mortgage
$3,000,000
Interest Rate
5.72%
Mortgage Type
Purchase Money Mortgage
Create a Home Valuation Report for This Property
The Home Valuation Report is an in-depth analysis detailing your home's value as well as a comparison with similar homes in the area
Home Values in the Area
Average Home Value in this Area
Purchase History
| Date | Buyer | Sale Price | Title Company |
|---|---|---|---|
| Howe Michael K | $384,488 | Chicago Title | |
| Northview Custom Homes Inc | $645,000 | Pnwt |
Source: Public Records
Mortgage History
| Date | Status | Borrower | Loan Amount |
|---|---|---|---|
| Open | Howe Michael K | $307,590 | |
| Previous Owner | Northview Custom Homes Inc | $3,000,000 |
Source: Public Records
Tax History Compared to Growth
Tax History
| Year | Tax Paid | Tax Assessment Tax Assessment Total Assessment is a certain percentage of the fair market value that is determined by local assessors to be the total taxable value of land and additions on the property. | Land | Improvement |
|---|---|---|---|---|
| 2025 | $5,643 | $739,500 | $283,000 | $456,500 |
| 2024 | $5,643 | $708,300 | $267,000 | $441,300 |
| 2023 | $5,622 | $727,100 | $276,000 | $451,100 |
| 2022 | $5,827 | $607,400 | $238,000 | $369,400 |
| 2020 | $5,221 | $495,600 | $174,000 | $321,600 |
| 2019 | $4,616 | $465,800 | $160,000 | $305,800 |
| 2018 | $4,469 | $417,900 | $130,000 | $287,900 |
| 2017 | $3,824 | $378,600 | $110,000 | $268,600 |
| 2016 | $3,493 | $331,900 | $98,000 | $233,900 |
| 2015 | $3,577 | $318,600 | $98,000 | $220,600 |
| 2013 | $2,976 | $244,800 | $73,000 | $171,800 |
Source: Public Records
Map
Nearby Homes
- 6321 176th Place NW
- 7519 184th St NW
- 690 X Olive Ave
- 6901 Olive Ave
- 6828 Olive Ave
- 0 Lakewood Rd Unit NWM2402864
- 0 Lakewood Rd Unit NWM2409174
- 8203 Lakewood Rd
- 4717 188th St NW
- 17930 82nd Dr NW
- 16507 60th Dr NW
- 16710 W Lake Goodwin Rd
- 8817 Lakewood Rd
- 16214 66th Ave NW
- 4230 174th Place NW
- 20909 Frank Waters Rd
- 20001 Marine Dr
- 15915 66th Ave NW
- 9003 196th Place NW
- 5619 Happy Hollow Rd
- 18610 64th Ave NW
- 18711 64th Ave NW
- 18625 64th Ave NW
- 18604 64th Ave NW
- 18732 64th Ave NW
- 18615 64th Ave NW
- 18727 64th Ave NW
- 18828 62nd Ave NW
- 18601 64th Ave NW
- 18818 62nd Ave NW
- 18906 62nd Ave NW
- 18803 64th Ave NW
- 18732 62nd Ave NW
- 18808 64th Ave NW
- 6402 185th St NW
- 6313 185th St NW
- 6328 185th St NW
- 18916 62nd Ave NW
- 18823 62nd Ave NW
- 18813 64th Ave NW