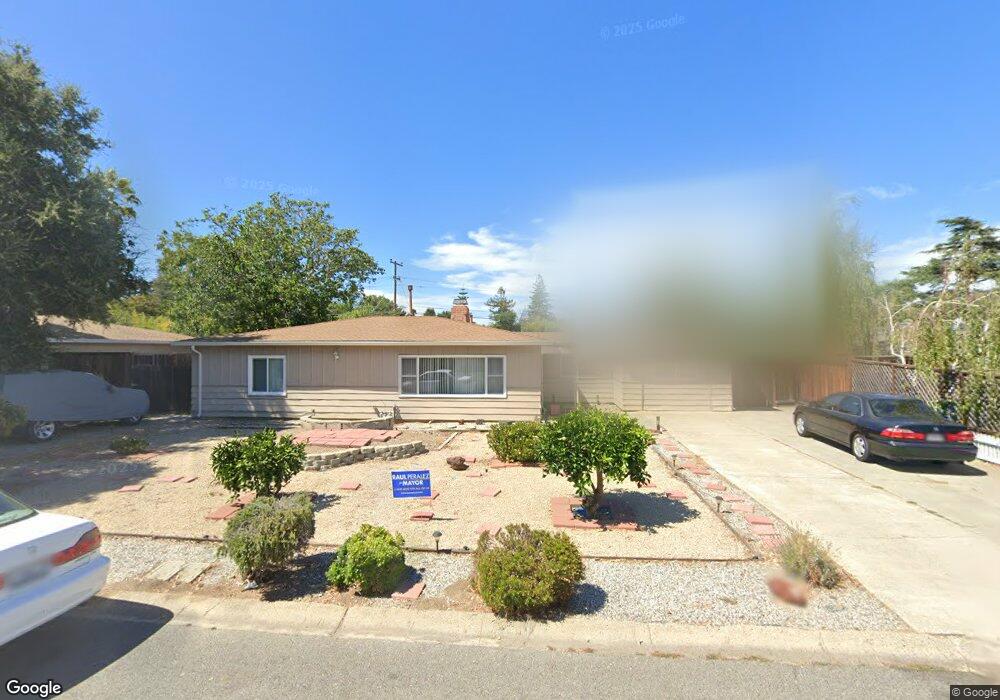
18629 Paseo Tierra Saratoga, CA 95070
Quito Village NeighborhoodEstimated Value: $2,341,000 - $2,620,000
3
Beds
3
Baths
1,260
Sq Ft
$1,955/Sq Ft
Est. Value
About This Home
This home is located at 18629 Paseo Tierra, Saratoga, CA 95070 and is currently estimated at $2,463,907, approximately $1,955 per square foot. 18629 Paseo Tierra is a home located in Santa Clara County with nearby schools including Gussie M. Baker Elementary School, Moreland Middle School, and Prospect High School.
Ownership History
Date
Name
Owned For
Owner Type
Purchase Details
Closed on
Jul 4, 2007
Sold by
Aurora Loan Services Llc
Bought by
Ling Mingrui and Wang Hong
Current Estimated Value
Home Financials for this Owner
Home Financials are based on the most recent Mortgage that was taken out on this home.
Original Mortgage
$417,000
Outstanding Balance
$263,754
Interest Rate
6.73%
Mortgage Type
Purchase Money Mortgage
Estimated Equity
$2,200,153
Purchase Details
Closed on
Oct 9, 2006
Sold by
Duldulao Eric and Duldulao Jocelyn
Bought by
Aurora Loan Services Llc
Purchase Details
Closed on
Mar 10, 2003
Sold by
Rosie Robert L and Park Barbara C
Bought by
Duldulao Eric and Duldulao Jocelyn
Home Financials for this Owner
Home Financials are based on the most recent Mortgage that was taken out on this home.
Original Mortgage
$520,000
Interest Rate
5.83%
Mortgage Type
Stand Alone First
Purchase Details
Closed on
Oct 10, 1997
Sold by
Rosie Louis D and Rosie Sylvia B
Bought by
Rosie Louis Donald
Create a Home Valuation Report for This Property
The Home Valuation Report is an in-depth analysis detailing your home's value as well as a comparison with similar homes in the area
Home Values in the Area
Average Home Value in this Area
Purchase History
| Date | Buyer | Sale Price | Title Company |
|---|---|---|---|
| Ling Mingrui | $873,000 | Fidelity National Title Co | |
| Aurora Loan Services Llc | $717,356 | None Available | |
| Duldulao Eric | $650,000 | Old Republic Title Company | |
| Rosie Louis Donald | -- | -- |
Source: Public Records
Mortgage History
| Date | Status | Borrower | Loan Amount |
|---|---|---|---|
| Open | Ling Mingrui | $417,000 | |
| Previous Owner | Duldulao Eric | $520,000 |
Source: Public Records
Tax History Compared to Growth
Tax History
| Year | Tax Paid | Tax Assessment Tax Assessment Total Assessment is a certain percentage of the fair market value that is determined by local assessors to be the total taxable value of land and additions on the property. | Land | Improvement |
|---|---|---|---|---|
| 2025 | $14,994 | $1,159,494 | $859,691 | $299,803 |
| 2024 | $14,994 | $1,136,760 | $842,835 | $293,925 |
| 2023 | $14,859 | $1,114,471 | $826,309 | $288,162 |
| 2022 | $14,633 | $1,092,619 | $810,107 | $282,512 |
| 2021 | $14,419 | $1,071,196 | $794,223 | $276,973 |
| 2020 | $14,204 | $1,060,213 | $786,080 | $274,133 |
| 2019 | $13,646 | $1,039,425 | $770,667 | $268,758 |
| 2018 | $13,376 | $1,019,045 | $755,556 | $263,489 |
| 2017 | $13,194 | $999,065 | $740,742 | $258,323 |
| 2016 | $12,464 | $979,476 | $726,218 | $253,258 |
| 2015 | $12,342 | $964,764 | $715,310 | $249,454 |
| 2014 | $12,045 | $945,867 | $701,299 | $244,568 |
Source: Public Records
Map
Nearby Homes
- 12584 Paseo Flores
- 11240 Cottonwood Place Unit 38-08 Plan 3
- 11315 Cottonwood Place Unit 39-09 Plan 3
- 11220 Cottonwood Place Unit 36-08 Plan 2
- 11155 Maple Place Unit 34-07 Plan 3
- 11145 Maple Place Unit 33-07 Plan 2
- 11210 Cottonwood Place Unit 35-08 Plan 4
- 11050 Maple Place Unit 29-06 Plan 3
- 11125 Maple Place Unit 31-07 Plan 2
- 10330 Elm Cir Unit 12-03 Plan 2
- 11040 Maple Place Unit 28-06 Plan 2
- 11115 Maple Place Unit 30-07
- 11645 Redwood Place Unit 56-12 Plan 4
- Plan 2 at The Elms
- Plan 3 at The Elms
- Plan 4 at The Elms
- 10750 Elm Cir Unit 88-17 Plan 2
- 10730 Elm Cir Unit 86-17 Plan 2
- 11010 Maple Place Unit 25-06 Plan 4
- 2090 Elmgrove Ln
- 18597 Paseo Tierra
- 18645 Paseo Tierra
- 18576 Bucknall Rd
- 18581 Paseo Tierra
- 18661 Paseo Tierra
- 18628 Bucknall Rd
- 18628 Paseo Tierra
- 18580 Bucknall Rd
- 18644 Paseo Tierra
- 18596 Paseo Tierra
- 18644 Bucknall Rd
- 18565 Paseo Tierra
- 18660 Paseo Tierra
- 12750 Paseo Presada
- 18580 Paseo Tierra
- 18564 Bucknall Rd
- 18676 Paseo Tierra
- 18564 Paseo Tierra
- 18549 Paseo Tierra
- 12681 Paseo Olivos