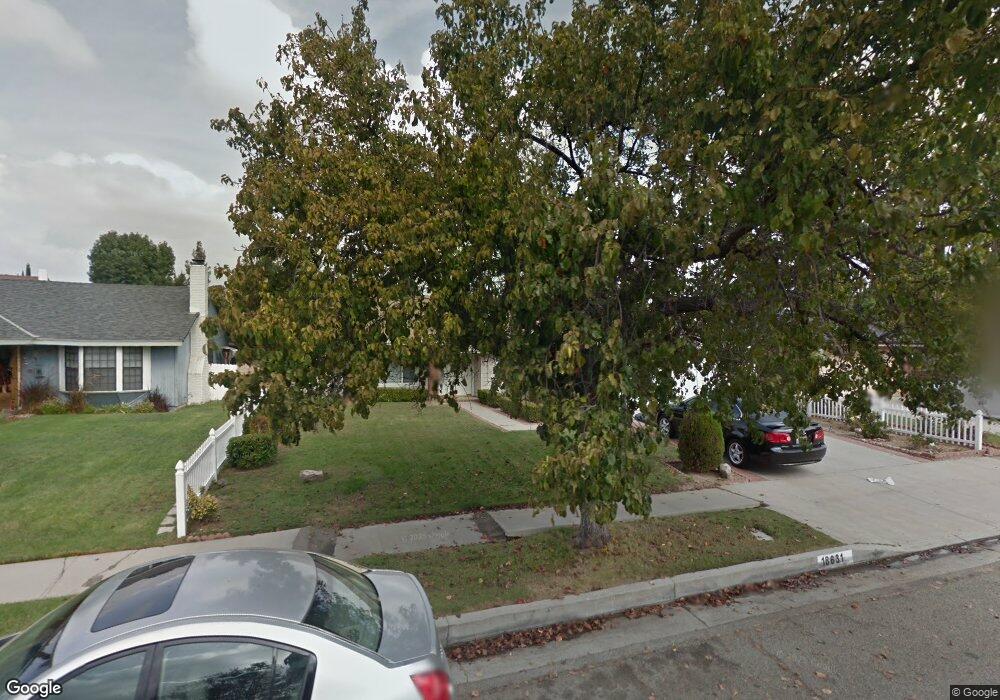
18631 Merridy St Northridge, CA 91324
Estimated Value: $904,000 - $1,029,000
3
Beds
2
Baths
1,656
Sq Ft
$582/Sq Ft
Est. Value
About This Home
This home is located at 18631 Merridy St, Northridge, CA 91324 and is currently estimated at $963,871, approximately $582 per square foot. 18631 Merridy St is a home located in Los Angeles County with nearby schools including Northridge Academy High, Valley Academy of Arts & Sciences, and Topeka Charter School For Advanced Studies.
Ownership History
Date
Name
Owned For
Owner Type
Purchase Details
Closed on
Jan 7, 2003
Sold by
Kim Un Mi
Bought by
Kim Hung Dong
Current Estimated Value
Home Financials for this Owner
Home Financials are based on the most recent Mortgage that was taken out on this home.
Original Mortgage
$280,000
Outstanding Balance
$118,929
Interest Rate
5.96%
Estimated Equity
$844,942
Purchase Details
Closed on
Aug 28, 2001
Sold by
Chang Jannie
Bought by
Kim Hung Dong
Home Financials for this Owner
Home Financials are based on the most recent Mortgage that was taken out on this home.
Original Mortgage
$273,600
Interest Rate
7.05%
Purchase Details
Closed on
Jan 26, 1994
Sold by
Chang Charles Yu Hsiung and Chang Chiu Chu Tsai
Bought by
Chang Charles Yu Hsiung
Purchase Details
Closed on
Jan 25, 1994
Sold by
Chang Charles Yu Hsiung and Chang Chiu Chu Tsai
Bought by
Chang Jannie
Create a Home Valuation Report for This Property
The Home Valuation Report is an in-depth analysis detailing your home's value as well as a comparison with similar homes in the area
Home Values in the Area
Average Home Value in this Area
Purchase History
| Date | Buyer | Sale Price | Title Company |
|---|---|---|---|
| Kim Hung Dong | -- | Chicago Title Co | |
| Kim Hung Dong | $288,000 | Gateway Title Company | |
| Chang Charles Yu Hsiung | -- | -- | |
| Chang Jannie | -- | -- |
Source: Public Records
Mortgage History
| Date | Status | Borrower | Loan Amount |
|---|---|---|---|
| Open | Kim Hung Dong | $280,000 | |
| Closed | Kim Hung Dong | $273,600 |
Source: Public Records
Tax History Compared to Growth
Tax History
| Year | Tax Paid | Tax Assessment Tax Assessment Total Assessment is a certain percentage of the fair market value that is determined by local assessors to be the total taxable value of land and additions on the property. | Land | Improvement |
|---|---|---|---|---|
| 2025 | $5,381 | $425,437 | $266,196 | $159,241 |
| 2024 | $5,381 | $417,096 | $260,977 | $156,119 |
| 2023 | $5,282 | $408,918 | $255,860 | $153,058 |
| 2022 | $5,044 | $400,901 | $250,844 | $150,057 |
| 2021 | $4,977 | $393,041 | $245,926 | $147,115 |
| 2019 | $4,834 | $381,385 | $238,633 | $142,752 |
| 2018 | $4,722 | $373,907 | $233,954 | $139,953 |
| 2016 | $4,505 | $359,389 | $224,870 | $134,519 |
| 2015 | $4,441 | $353,992 | $221,493 | $132,499 |
| 2014 | $4,463 | $347,059 | $217,155 | $129,904 |
Source: Public Records
Map
Nearby Homes
- 10116 Viking Ave
- 18524 Mayall St Unit D
- 18526 Mayall St Unit L
- 18753 Mayall St
- 10004 Reseda Blvd Unit D
- 10126 Reseda Blvd Unit 121
- 10126 Reseda Blvd Unit 112
- 9854 Canby Ave
- 9763 Reseda Blvd Unit 83
- 9625 Yolanda Ave
- 18170 Andrea Cir N Unit 1
- 10225 Donna Ave
- 9819 Vanalden Ave
- 9506 Yolanda Ave
- 18131 Andrea Cir N Unit 4
- 18839 Plummer St
- 10535 Reseda Blvd
- 18741 Hillsboro Rd
- 19200 Ballinger St
- 9301 Darby Ave
- 18623 Merridy St
- 18637 Merridy St
- 18630 Stare St
- 18624 Stare St
- 18617 Merridy St
- 18643 Merridy St
- 18638 Stare St
- 18618 Stare St
- 18648 Stare St
- 18632 Merridy St
- 18638 Merridy St
- 18624 Merridy St
- 18649 Merridy St
- 18611 Merridy St
- 18644 Merridy St
- 18618 Merridy St
- 18612 Stare St
- 10010 Yolanda Ave
- 18650 Merridy St
- 18614 Merridy St