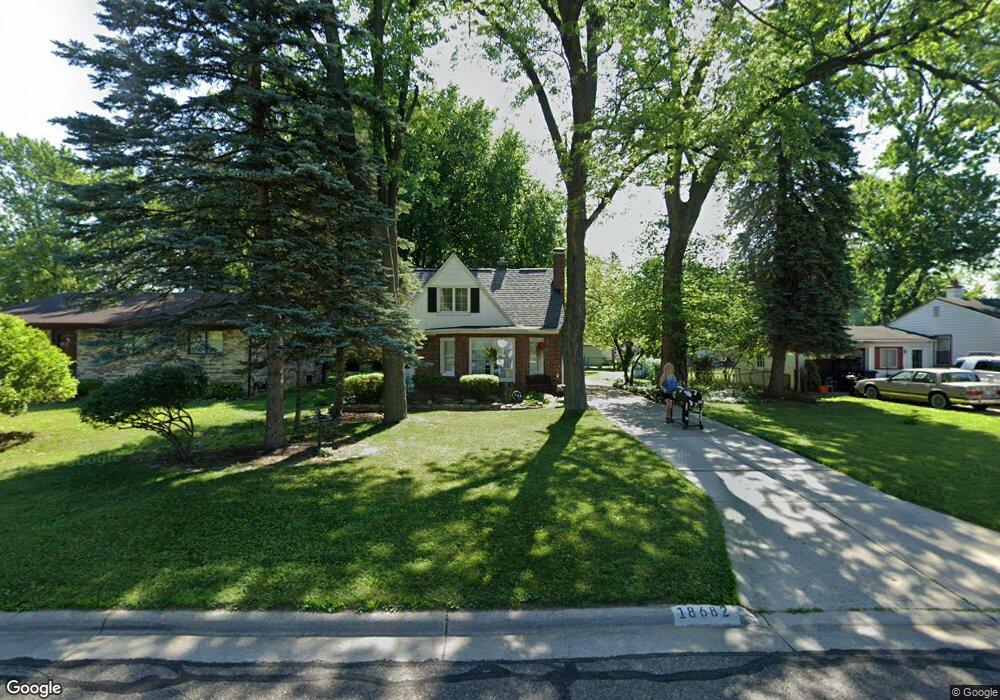
18682 Lathers St Livonia, MI 48152
Estimated Value: $188,547 - $216,000
3
Beds
1
Bath
1,229
Sq Ft
$163/Sq Ft
Est. Value
About This Home
This home is located at 18682 Lathers St, Livonia, MI 48152 and is currently estimated at $200,887, approximately $163 per square foot. 18682 Lathers St is a home located in Wayne County with nearby schools including Clarenceville High School, David Ellis Academy West, and Concordia Lutheran School.
Ownership History
Date
Name
Owned For
Owner Type
Purchase Details
Closed on
Jun 18, 2021
Sold by
Shelest Lisa Gaye
Bought by
Reardon Micallf Sara Elizabeth and Devore Devin Michael
Current Estimated Value
Purchase Details
Closed on
Nov 19, 2010
Sold by
Johnson Erma L and Johnson Thomas
Bought by
Shelest Lisa G
Home Financials for this Owner
Home Financials are based on the most recent Mortgage that was taken out on this home.
Original Mortgage
$6,305
Interest Rate
4.19%
Mortgage Type
Second Mortgage Made To Cover Down Payment
Purchase Details
Closed on
Sep 30, 2010
Sold by
Johnson Erma L
Bought by
Johnson Erma L
Home Financials for this Owner
Home Financials are based on the most recent Mortgage that was taken out on this home.
Original Mortgage
$57,970
Interest Rate
5.5%
Mortgage Type
FHA
Purchase Details
Closed on
Apr 15, 2003
Sold by
Johnson Erma L and Johnson Charles A
Bought by
Johnson Erma L and Erma L Johnson Trust
Create a Home Valuation Report for This Property
The Home Valuation Report is an in-depth analysis detailing your home's value as well as a comparison with similar homes in the area
Home Values in the Area
Average Home Value in this Area
Purchase History
| Date | Buyer | Sale Price | Title Company |
|---|---|---|---|
| Reardon Micallf Sara Elizabeth | -- | None Available | |
| Shelest Lisa G | $60,000 | Abstract Title Agency | |
| Johnson Erma L | -- | Abstract Title Agency | |
| Johnson Erma L | -- | -- |
Source: Public Records
Mortgage History
| Date | Status | Borrower | Loan Amount |
|---|---|---|---|
| Previous Owner | Shelest Lisa G | $6,305 | |
| Previous Owner | Shelest Lisa G | $57,970 |
Source: Public Records
Tax History Compared to Growth
Tax History
| Year | Tax Paid | Tax Assessment Tax Assessment Total Assessment is a certain percentage of the fair market value that is determined by local assessors to be the total taxable value of land and additions on the property. | Land | Improvement |
|---|---|---|---|---|
| 2025 | $932 | $84,100 | $0 | $0 |
| 2024 | $932 | $77,300 | $0 | $0 |
| 2023 | $890 | $70,900 | $0 | $0 |
| 2022 | $1,480 | $62,900 | $0 | $0 |
| 2021 | $1,441 | $58,900 | $0 | $0 |
| 2019 | $1,404 | $47,800 | $0 | $0 |
| 2018 | $772 | $47,100 | $0 | $0 |
| 2017 | $1,185 | $42,800 | $0 | $0 |
| 2016 | $1,316 | $42,100 | $0 | $0 |
| 2015 | $3,462 | $38,350 | $0 | $0 |
| 2012 | -- | $34,790 | $12,450 | $22,340 |
Source: Public Records
Map
Nearby Homes
- 18913 Gillman St
- 18884 Lathers St
- 18404 Deering St
- 18411 Foch St
- 18071 Floral St
- 18061 Lathers St
- 18206 Foch St
- 18570 Pershing St
- 18001 Floral St
- 18626 Inkster Rd
- 19169 Inkster Rd
- 18851 Poinciana
- 19499 Saint Francis St
- 29560 Clarita St Unit 11
- 19435 Inkster Rd
- 19424 Inkster Rd
- 27427 Vargo St
- 19661 Antago St
- 29721 Pickford St
- 19643 Inkster Rd
- 18692 Lathers St
- 18674 Lathers St
- 18549 Gillman St
- 18537 Gillman St
- 18563 Gillman St
- 18525 Gillman St
- 18666 Lathers St
- 18585 Gillman St
- 18513 Gillman St
- 18780 Lathers St
- 18501 Gillman St
- 18597 Gillman St
- 18675 Lathers St
- 18671 Lathers St
- 18699 Lathers St
- 18489 Gillman St
- 18662 Lathers St
- 18609 Gillman St
- 18665 Lathers St
- 18779 Lathers St