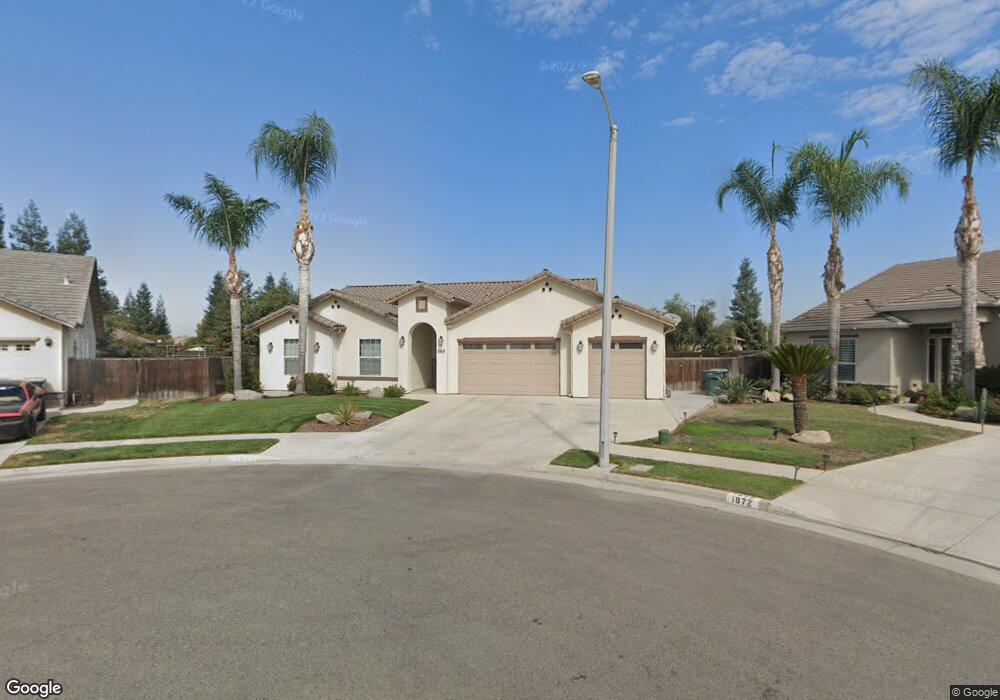
1869 Naval Ct Tulare, CA 93274
Estimated Value: $444,000 - $624,000
4
Beds
2
Baths
2,196
Sq Ft
$227/Sq Ft
Est. Value
About This Home
This home is located at 1869 Naval Ct, Tulare, CA 93274 and is currently estimated at $498,022, approximately $226 per square foot. 1869 Naval Ct is a home located in Tulare County with nearby schools including Heritage Elementary School, Los Tules Middle School, and Tulare Western High School.
Ownership History
Date
Name
Owned For
Owner Type
Purchase Details
Closed on
Jun 21, 2011
Sold by
Federal National Mortgage Association
Bought by
Desousa John
Current Estimated Value
Home Financials for this Owner
Home Financials are based on the most recent Mortgage that was taken out on this home.
Original Mortgage
$175,920
Outstanding Balance
$120,876
Interest Rate
4.56%
Mortgage Type
New Conventional
Estimated Equity
$377,146
Purchase Details
Closed on
Mar 21, 2011
Sold by
Wales Ken and Wales Nicole
Bought by
Federal National Mortgage Association
Purchase Details
Closed on
Jan 24, 2008
Sold by
Blain Construction Co Inc
Bought by
Wales Ken and Wales Nicole
Home Financials for this Owner
Home Financials are based on the most recent Mortgage that was taken out on this home.
Original Mortgage
$279,450
Interest Rate
5.41%
Mortgage Type
New Conventional
Create a Home Valuation Report for This Property
The Home Valuation Report is an in-depth analysis detailing your home's value as well as a comparison with similar homes in the area
Home Values in the Area
Average Home Value in this Area
Purchase History
| Date | Buyer | Sale Price | Title Company |
|---|---|---|---|
| Desousa John | $220,000 | Lawyers Title Insurance Corp | |
| Federal National Mortgage Association | $233,815 | Landsafe Title | |
| Wales Ken | $310,000 | Chicago Title Company |
Source: Public Records
Mortgage History
| Date | Status | Borrower | Loan Amount |
|---|---|---|---|
| Open | Desousa John | $175,920 | |
| Previous Owner | Wales Ken | $279,450 |
Source: Public Records
Tax History Compared to Growth
Tax History
| Year | Tax Paid | Tax Assessment Tax Assessment Total Assessment is a certain percentage of the fair market value that is determined by local assessors to be the total taxable value of land and additions on the property. | Land | Improvement |
|---|---|---|---|---|
| 2025 | $3,292 | $281,726 | $38,433 | $243,293 |
| 2024 | $3,292 | $276,203 | $37,680 | $238,523 |
| 2023 | $3,203 | $270,789 | $36,942 | $233,847 |
| 2022 | $3,108 | $265,480 | $36,218 | $229,262 |
| 2021 | $3,061 | $260,275 | $35,508 | $224,767 |
| 2020 | $3,105 | $257,606 | $35,144 | $222,462 |
| 2019 | $3,173 | $252,555 | $34,455 | $218,100 |
| 2018 | $3,114 | $247,603 | $33,779 | $213,824 |
| 2017 | $3,066 | $242,748 | $33,117 | $209,631 |
| 2016 | $2,939 | $237,989 | $32,468 | $205,521 |
| 2015 | $2,812 | $234,414 | $31,980 | $202,434 |
| 2014 | $2,812 | $227,000 | $57,000 | $170,000 |
Source: Public Records
Map
Nearby Homes
- 1721 Cotton Ct
- 384 Mitchell Ave
- 382 Hemmingway Ct
- 1977 Irving Cir
- 202 W Gail Ave
- 2459 N Oaks St Unit 37
- 2459 N Oaks St Unit 120
- 2459 N Oaks St Unit 127
- 2459 N Oaks St Unit 28
- 2459 N Oaks St Unit 46
- 1266 N H St
- 1287 Palo Alto St
- 148 E Gail Ave
- 1149 N E St
- 182 E Kennedy Ave
- 230 E Kennedy Ave
- 1 M St
- 183 Oaks Ct
- 704 Lassen Ave
- 0 Cartmill Ave Ave Unit 121103
- 1849 Naval Ct
- 1871 Naval Ct
- 1872 Naval Ct
- 741 Zumwalt Ave
- 1848 Admiral Ct
- 2059 N E St
- 1846 Naval Ct
- 1870 Admiral Ct
- 755 Zumwalt Ave
- 1825 Naval Ct
- 1828 Naval Ct
- 1826 Admiral Ct
- 767 Zumwalt Ave
- 1867 Admiral Ct
- 743 Admiral Ave
- 1845 Admiral Ct
- 735 Admiral Ave
- 789 Zumwalt Ave
- 755 Admiral Ave
- 721 Admiral Ave