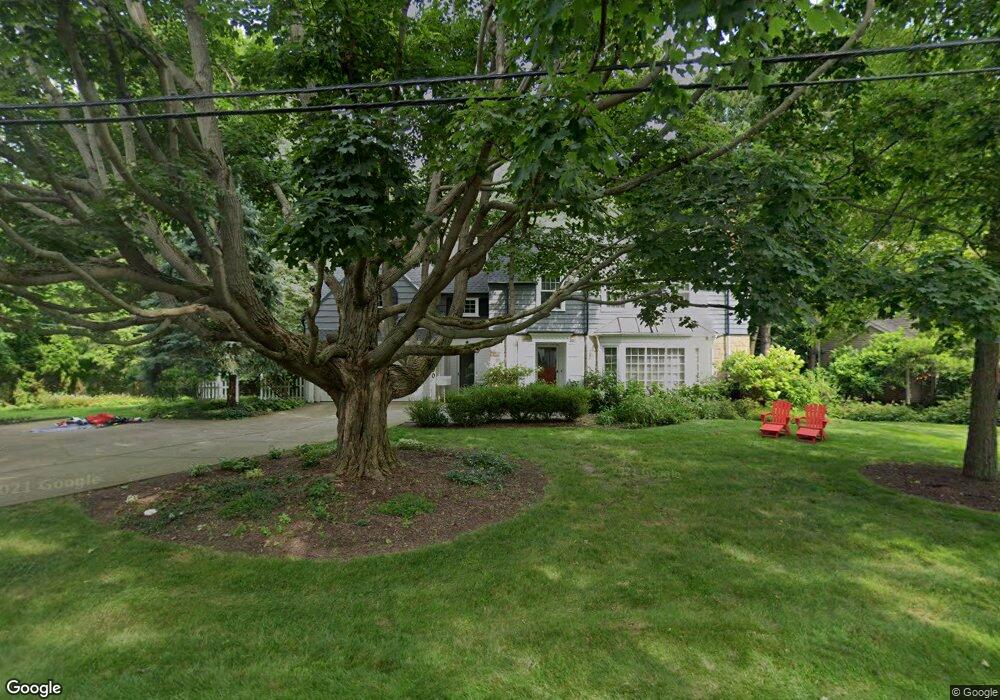
18690 Rivercliff Dr Cleveland, OH 44126
Estimated Value: $301,000 - $482,000
4
Beds
2
Baths
2,091
Sq Ft
$200/Sq Ft
Est. Value
About This Home
This home is located at 18690 Rivercliff Dr, Cleveland, OH 44126 and is currently estimated at $417,741, approximately $199 per square foot. 18690 Rivercliff Dr is a home located in Cuyahoga County with nearby schools including Gilles-Sweet Elementary School, Lewis F Mayer Middle School, and Fairview High School.
Ownership History
Date
Name
Owned For
Owner Type
Purchase Details
Closed on
Apr 19, 2001
Sold by
Koster Anne T and Ault Anne T
Bought by
Ault Thomas M and Ault Anne T
Current Estimated Value
Home Financials for this Owner
Home Financials are based on the most recent Mortgage that was taken out on this home.
Original Mortgage
$240,000
Outstanding Balance
$89,066
Interest Rate
7.11%
Estimated Equity
$328,675
Purchase Details
Closed on
Apr 23, 1990
Bought by
Koster Thomas J
Purchase Details
Closed on
Feb 23, 1990
Sold by
Lawitis Michael D
Bought by
Kraft General Foods, Inc
Purchase Details
Closed on
Mar 9, 1984
Sold by
Neimeth Bruce
Bought by
Lawitis Michael D
Purchase Details
Closed on
Aug 30, 1982
Sold by
Fitzgerald John F and Fitzgerald Nadine
Bought by
Neimeth Bruce
Purchase Details
Closed on
Jan 1, 1975
Bought by
Fitzgerald John F and Fitzgerald Nadine
Create a Home Valuation Report for This Property
The Home Valuation Report is an in-depth analysis detailing your home's value as well as a comparison with similar homes in the area
Home Values in the Area
Average Home Value in this Area
Purchase History
| Date | Buyer | Sale Price | Title Company |
|---|---|---|---|
| Ault Thomas M | -- | -- | |
| Koster Thomas J | $198,000 | -- | |
| Kraft General Foods, Inc | $196,000 | -- | |
| Lawitis Michael D | $148,000 | -- | |
| Neimeth Bruce | $145,000 | -- | |
| Fitzgerald John F | -- | -- |
Source: Public Records
Mortgage History
| Date | Status | Borrower | Loan Amount |
|---|---|---|---|
| Open | Ault Thomas M | $240,000 |
Source: Public Records
Tax History Compared to Growth
Tax History
| Year | Tax Paid | Tax Assessment Tax Assessment Total Assessment is a certain percentage of the fair market value that is determined by local assessors to be the total taxable value of land and additions on the property. | Land | Improvement |
|---|---|---|---|---|
| 2024 | $9,665 | $141,750 | $32,655 | $109,095 |
| 2023 | $10,758 | $135,740 | $28,530 | $107,210 |
| 2022 | $10,491 | $135,730 | $28,530 | $107,210 |
| 2021 | $10,755 | $135,730 | $28,530 | $107,210 |
| 2020 | $10,465 | $116,030 | $24,400 | $91,630 |
| 2019 | $9,288 | $331,500 | $69,700 | $261,800 |
| 2018 | $9,305 | $116,030 | $24,400 | $91,630 |
| 2017 | $9,197 | $106,230 | $18,550 | $87,680 |
| 2016 | $9,134 | $106,230 | $18,550 | $87,680 |
| 2015 | $7,876 | $106,230 | $18,550 | $87,680 |
| 2014 | $7,876 | $92,370 | $16,140 | $76,230 |
Source: Public Records
Map
Nearby Homes
- 4139 W Valley Dr
- 4120 W Valley Dr
- 18875 Riversouth Trace Unit 30
- 18875 Riversouth Terrace Unit 35
- 18875 Riversouth Terrace Unit 27
- 3960 W Valley Dr
- 17517 Oxford Ave
- 19270 Lorain Rd
- 3601 Eldorado Dr
- 19510 Lorain Rd Unit 201
- 18877 N Valley Dr
- 19575 Henry Rd
- 3726 W 169th St
- 4336 W 196th St
- 17301 Bradgate Ave
- 17706 Susan Ave
- 17705 Susan Ave
- 16715 Claire Ave
- 3472 W 159th St
- 3457 Wooster Rd
- 18680 Rivercliff Dr
- 18740 Rivercliff Dr
- 18760 Rivercliff Dr
- 18660 Rivercliff Dr
- 18681 Rivercliff Dr
- 18701 Rivercliff Dr
- 4179 W Valley Dr
- 18661 Rivercliff Dr
- 18741 Rivercliff Dr
- 4169 W Valley Dr
- 18780 Rivercliff Dr
- 18630 Rivercliff Dr
- 18645 Rivercliff Dr
- 18849 W Valley Dr
- 4159 W Valley Dr
- 18761 Rivercliff Dr
- 18800 Rivercliff Dr
- 18600 Rivercliff Dr
- 18781 Rivercliff Dr
- 18859 W Valley Dr