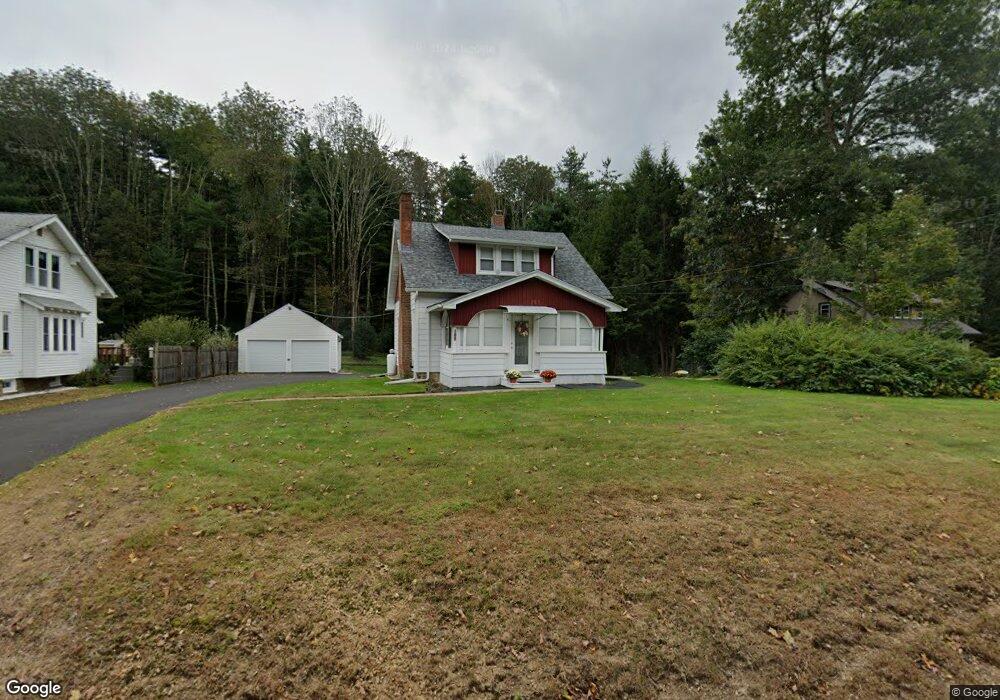
187 East St Stafford Springs, CT 06076
Stafford NeighborhoodEstimated Value: $260,000 - $296,896
3
Beds
2
Baths
1,282
Sq Ft
$220/Sq Ft
Est. Value
About This Home
This home is located at 187 East St, Stafford Springs, CT 06076 and is currently estimated at $281,724, approximately $219 per square foot. 187 East St is a home located in Tolland County with nearby schools including Stafford Elementary School, Stafford Middle School, and Stafford High School.
Ownership History
Date
Name
Owned For
Owner Type
Purchase Details
Closed on
May 27, 2014
Sold by
Hsbc Mortgage Services
Bought by
Wilmont Lila A
Current Estimated Value
Purchase Details
Closed on
Mar 20, 2002
Sold by
Parker Edward and Parker Dorraine
Bought by
Osullivan Jane
Home Financials for this Owner
Home Financials are based on the most recent Mortgage that was taken out on this home.
Original Mortgage
$102,300
Interest Rate
6.91%
Purchase Details
Closed on
Nov 19, 2001
Sold by
Kroussmann John and Kroussmann Katherine
Bought by
Sepulveda Richard
Home Financials for this Owner
Home Financials are based on the most recent Mortgage that was taken out on this home.
Original Mortgage
$156,310
Interest Rate
6.7%
Purchase Details
Closed on
Jul 2, 1990
Sold by
Estabrook Carolyn A
Bought by
Parker Edward R
Create a Home Valuation Report for This Property
The Home Valuation Report is an in-depth analysis detailing your home's value as well as a comparison with similar homes in the area
Home Values in the Area
Average Home Value in this Area
Purchase History
| Date | Buyer | Sale Price | Title Company |
|---|---|---|---|
| Wilmont Lila A | $92,000 | -- | |
| Osullivan Jane | $112,000 | -- | |
| Sepulveda Richard | $154,000 | -- | |
| Parker Edward R | $123,500 | -- |
Source: Public Records
Mortgage History
| Date | Status | Borrower | Loan Amount |
|---|---|---|---|
| Open | Parker Edward R | $12,500 | |
| Previous Owner | Parker Edward R | $102,300 | |
| Previous Owner | Parker Edward R | $156,310 |
Source: Public Records
Tax History Compared to Growth
Tax History
| Year | Tax Paid | Tax Assessment Tax Assessment Total Assessment is a certain percentage of the fair market value that is determined by local assessors to be the total taxable value of land and additions on the property. | Land | Improvement |
|---|---|---|---|---|
| 2025 | $6,251 | $105,700 | $27,510 | $78,190 |
| 2024 | $4,079 | $105,700 | $27,510 | $78,190 |
| 2023 | $3,886 | $105,700 | $27,510 | $78,190 |
| 2022 | $3,782 | $105,700 | $27,510 | $78,190 |
| 2021 | $3,692 | $105,700 | $27,510 | $78,190 |
| 2020 | $3,687 | $105,560 | $30,590 | $74,970 |
| 2019 | $3,636 | $104,090 | $30,590 | $73,500 |
| 2018 | $3,566 | $104,090 | $30,590 | $73,500 |
| 2017 | $3,532 | $104,090 | $30,590 | $73,500 |
| 2016 | $3,488 | $104,090 | $30,590 | $73,500 |
| 2015 | $3,081 | $104,090 | $30,590 | $73,500 |
| 2014 | $3,438 | $104,090 | $30,590 | $73,500 |
Source: Public Records
Map
Nearby Homes