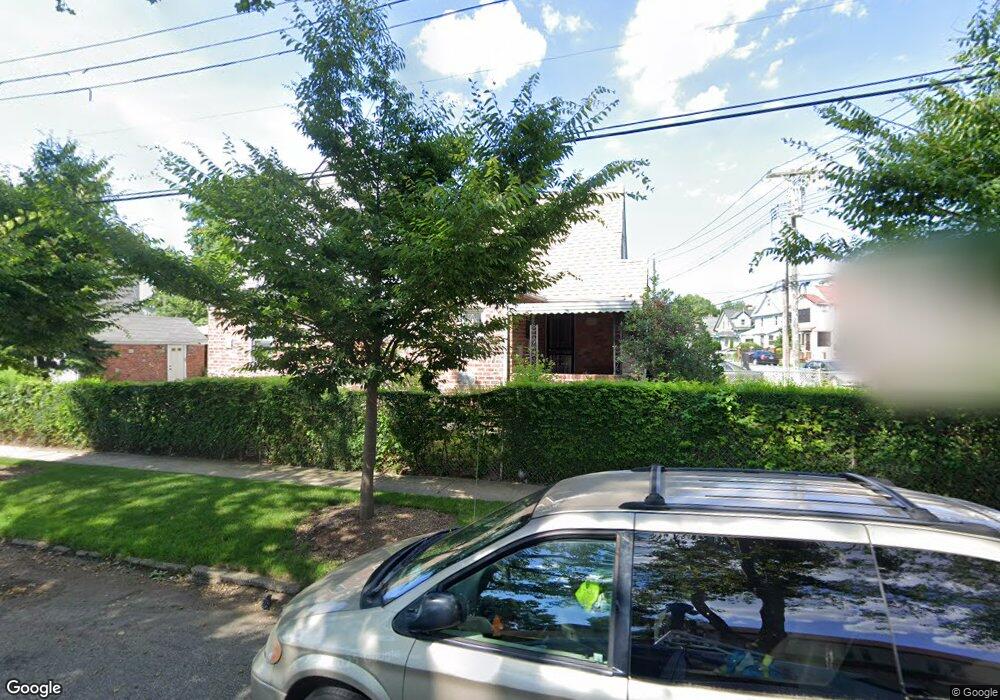
18701 Williamson Ave Springfield Gardens, NY 11413
Saint Albans NeighborhoodEstimated Value: $693,623 - $868,000
--
Bed
--
Bath
1,475
Sq Ft
$521/Sq Ft
Est. Value
About This Home
This home is located at 18701 Williamson Ave, Springfield Gardens, NY 11413 and is currently estimated at $768,656, approximately $521 per square foot. 18701 Williamson Ave is a home located in Queens County with nearby schools including P.S. 15 Jackie Robinson, Is 59 Springfield Gardens, and Success Academy Springfield Gardens.
Ownership History
Date
Name
Owned For
Owner Type
Purchase Details
Closed on
Apr 25, 2018
Sold by
Ireland Joyce and Velasquez Griffith Florence
Bought by
Ireland Joyce and Scott Shanay
Current Estimated Value
Purchase Details
Closed on
Dec 22, 2016
Sold by
Ireland Joyce
Bought by
Ireland Joyce and Velasquez Griffith Florence
Home Financials for this Owner
Home Financials are based on the most recent Mortgage that was taken out on this home.
Original Mortgage
$363,145
Interest Rate
4.08%
Mortgage Type
FHA
Purchase Details
Closed on
Jul 28, 1994
Sold by
Ireland Allan
Bought by
Ireland Joyce
Home Financials for this Owner
Home Financials are based on the most recent Mortgage that was taken out on this home.
Original Mortgage
$90,000
Interest Rate
8.56%
Create a Home Valuation Report for This Property
The Home Valuation Report is an in-depth analysis detailing your home's value as well as a comparison with similar homes in the area
Home Values in the Area
Average Home Value in this Area
Purchase History
| Date | Buyer | Sale Price | Title Company |
|---|---|---|---|
| Ireland Joyce | -- | -- | |
| Ireland Joyce | -- | -- | |
| Ireland Joyce | -- | -- | |
| Ireland Joyce | -- | -- | |
| Ireland Joyce | -- | Commonwealth Land Title Ins | |
| Ireland Joyce | -- | Commonwealth Land Title Ins |
Source: Public Records
Mortgage History
| Date | Status | Borrower | Loan Amount |
|---|---|---|---|
| Previous Owner | Ireland Joyce | $363,145 | |
| Previous Owner | Ireland Joyce | $90,000 |
Source: Public Records
Tax History Compared to Growth
Tax History
| Year | Tax Paid | Tax Assessment Tax Assessment Total Assessment is a certain percentage of the fair market value that is determined by local assessors to be the total taxable value of land and additions on the property. | Land | Improvement |
|---|---|---|---|---|
| 2025 | $5,434 | $32,704 | $10,598 | $22,106 |
| 2024 | $5,538 | $30,854 | $10,495 | $20,359 |
| 2023 | $5,382 | $30,594 | $10,140 | $20,454 |
| 2022 | $5,103 | $41,400 | $13,980 | $27,420 |
| 2021 | $5,415 | $38,880 | $13,980 | $24,900 |
| 2020 | $5,110 | $36,240 | $13,980 | $22,260 |
| 2019 | $4,720 | $31,500 | $13,980 | $17,520 |
| 2018 | $4,538 | $25,495 | $13,084 | $12,411 |
| 2017 | $4,257 | $24,052 | $12,104 | $11,948 |
| 2016 | $4,187 | $24,052 | $12,104 | $11,948 |
| 2015 | $2,517 | $22,711 | $13,014 | $9,697 |
| 2014 | $2,517 | $21,427 | $14,720 | $6,707 |
Source: Public Records
Map
Nearby Homes
- 187-04 Williamson Ave
- 187-16 Williamson Ave
- 18806 Nashville Blvd
- 12253 Milburn St
- 187-01 Ridgedale St
- 122-66 Nellis St
- 12251 Grayson St
- 12248 Benton St
- 12512 Nepton St
- 12244 Nellis St
- 122-22 Nellis St
- 21611 135th Ave
- 21608 Merrick Blvd
- 19115 Williamson Ave
- 19009 122nd Ave
- 12133 Grayson St
- 17913 134th Ave
- 191-01 122nd Ave
- 216-25 136th Rd
- 192-17 Williamson Ave
- 187-01 Williamson Ave
- 18705 Williamson Ave
- 12327 Milburn St
- 18711 Williamson Ave
- 187-11 Williamson Ave
- 18619 Williamson Ave
- 186-19 Williamson Ave
- 12323 Milburn St
- 12334 Milburn St
- 18719 Williamson Ave
- 12328 Milburn St
- 18611 Williamson Ave
- 12319 Milburn St
- 12326 Grayson St
- 18712 Williamson Ave
- 18706 Williamson Ave
- 187-06 Williamson Ave
- 18704 Williamson Ave
- 187-19 Williamson Ave
- 12324 Milburn St