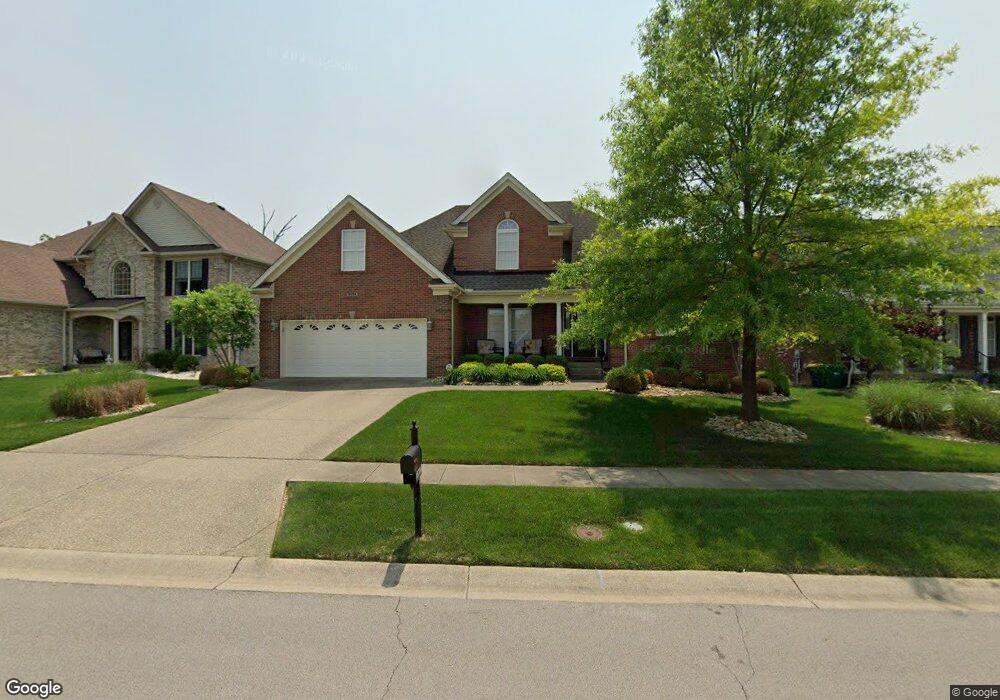
18704 Westbourne Grove Dr Louisville, KY 40245
Estimated Value: $497,969 - $602,000
4
Beds
3
Baths
2,533
Sq Ft
$217/Sq Ft
Est. Value
About This Home
This home is located at 18704 Westbourne Grove Dr, Louisville, KY 40245 and is currently estimated at $548,992, approximately $216 per square foot. 18704 Westbourne Grove Dr is a home located in Jefferson County with nearby schools including Middletown Elementary School, Hite Elementary School, and Lowe Elementary School.
Ownership History
Date
Name
Owned For
Owner Type
Purchase Details
Closed on
Aug 15, 2011
Sold by
Judy Eleanor C and Judy Harry Jack
Bought by
Adkisson Donald W and Adkisson Linda
Current Estimated Value
Purchase Details
Closed on
Aug 29, 2006
Sold by
Hartung Builders Inc
Bought by
Goodman Eleanor C
Home Financials for this Owner
Home Financials are based on the most recent Mortgage that was taken out on this home.
Original Mortgage
$198,740
Interest Rate
6.73%
Mortgage Type
Purchase Money Mortgage
Purchase Details
Closed on
Nov 23, 2005
Sold by
Notting Hill Development Llc
Bought by
Hartung Builders Inc
Home Financials for this Owner
Home Financials are based on the most recent Mortgage that was taken out on this home.
Original Mortgage
$288,000
Interest Rate
6%
Mortgage Type
Purchase Money Mortgage
Create a Home Valuation Report for This Property
The Home Valuation Report is an in-depth analysis detailing your home's value as well as a comparison with similar homes in the area
Home Values in the Area
Average Home Value in this Area
Purchase History
| Date | Buyer | Sale Price | Title Company |
|---|---|---|---|
| Adkisson Donald W | $315,000 | None Available | |
| Goodman Eleanor C | $338,740 | None Available | |
| Hartung Builders Inc | $72,000 | None Available |
Source: Public Records
Mortgage History
| Date | Status | Borrower | Loan Amount |
|---|---|---|---|
| Previous Owner | Goodman Eleanor C | $198,740 | |
| Previous Owner | Hartung Builders Inc | $288,000 |
Source: Public Records
Tax History Compared to Growth
Tax History
| Year | Tax Paid | Tax Assessment Tax Assessment Total Assessment is a certain percentage of the fair market value that is determined by local assessors to be the total taxable value of land and additions on the property. | Land | Improvement |
|---|---|---|---|---|
| 2024 | -- | $399,230 | $71,040 | $328,190 |
| 2023 | $4,086 | $399,230 | $71,040 | $328,190 |
| 2022 | $4,168 | $318,030 | $70,000 | $248,030 |
| 2021 | $3,483 | $318,030 | $70,000 | $248,030 |
| 2020 | $3,211 | $318,030 | $70,000 | $248,030 |
| 2019 | $3,146 | $318,030 | $70,000 | $248,030 |
| 2018 | $3,002 | $318,030 | $70,000 | $248,030 |
| 2017 | $2,943 | $318,030 | $70,000 | $248,030 |
| 2013 | $3,150 | $315,000 | $72,000 | $243,000 |
Source: Public Records
Map
Nearby Homes
- 116 Pembridge Ct
- 18624 Chadwick Glen Cir
- 604 Weymuth Place
- 18741 Willington Cir
- 19010 Long Grove Way
- 1211 Forest Trail Place
- 320 Longview Park Place
- 18410 Shallowford Ln
- 1110 Clark Station Rd
- 205 Locust Park Place
- 642-646 Hobbs Ln
- 18240 Hobbs Creek Rd
- 1536 Lincoln Hill Way
- 42 Lincoln Hill Way
- 1126 Grazing Meadows Ln
- 17415 Polo Run Ln
- 0 Clark Station Rd Unit 1699276
- 16507 Kilcott Way
- 113 Chestnut Glen Dr
- Fairfax Plan at Bridle Run - Maple Street Collection
- 18706 Westbourne Grove Dr
- 18702 Westbourne Grove Dr
- 215 Notting Hill Blvd
- 18708 Westbourne Grove Dr
- 219 Notting Hill Blvd
- 217 Notting Hill Blvd
- 18705 Westbourne Grove Dr
- 213 Notting Hill Blvd
- 18707 Westbourne Grove Dr
- 18703 Westbourne Grove Dr
- 18709 Westbourne Grove Dr
- 18710 Westbourne Grove Dr
- 221 Notting Hill Blvd
- 301 Cranbury Way
- 211 Notting Hill Blvd
- 301 Crandell Ct
- 0 Cranbury Way
- 18704 Cranbury Ct
- 18706 Cranbury Ct
- 18708 Cranbury Ct