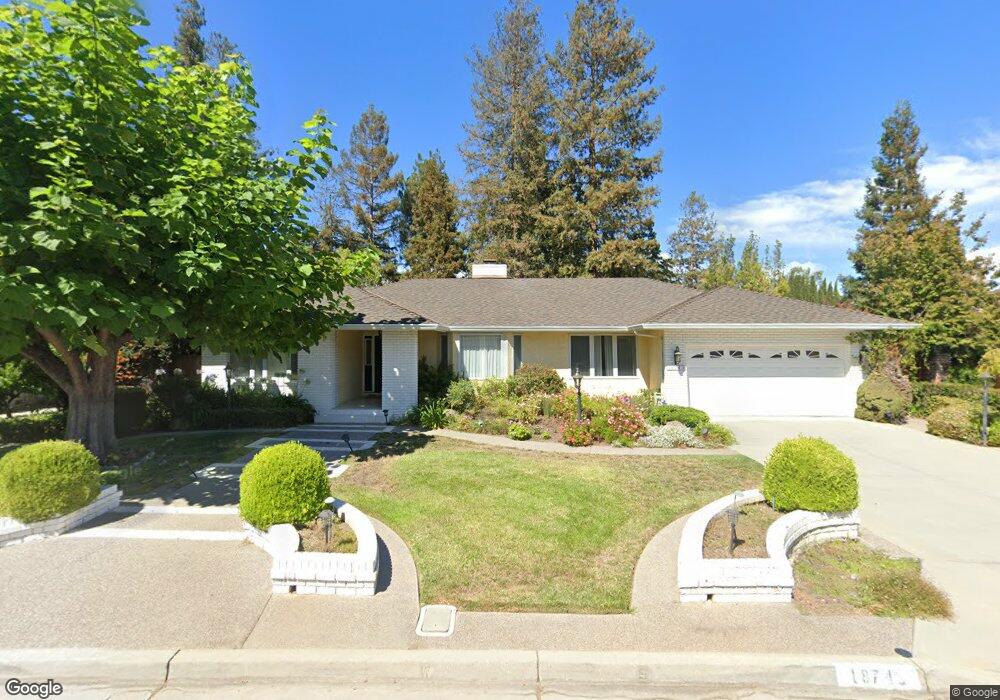
18743 Cabernet Dr Saratoga, CA 95070
West San Jose NeighborhoodEstimated Value: $3,293,628 - $3,645,000
4
Beds
3
Baths
2,383
Sq Ft
$1,481/Sq Ft
Est. Value
About This Home
This home is located at 18743 Cabernet Dr, Saratoga, CA 95070 and is currently estimated at $3,529,407, approximately $1,481 per square foot. 18743 Cabernet Dr is a home located in Santa Clara County with nearby schools including Country Lane Elementary School, Moreland Middle School, and Prospect High School.
Ownership History
Date
Name
Owned For
Owner Type
Purchase Details
Closed on
Oct 25, 2016
Sold by
Le Toan P and Chow Nicolette W
Bought by
Le Toan P and Chow Nicolette W
Current Estimated Value
Purchase Details
Closed on
Feb 19, 2008
Sold by
Le Toan P and Chow Nicolette
Bought by
Le Toan P and Chow Nicolette W
Home Financials for this Owner
Home Financials are based on the most recent Mortgage that was taken out on this home.
Original Mortgage
$556,000
Outstanding Balance
$335,581
Interest Rate
5.25%
Mortgage Type
New Conventional
Estimated Equity
$3,193,826
Purchase Details
Closed on
Oct 30, 2000
Sold by
Harkey Byron J and Harkey Mary F
Bought by
Le Toan P and Chow Nicolette
Home Financials for this Owner
Home Financials are based on the most recent Mortgage that was taken out on this home.
Original Mortgage
$600,000
Interest Rate
8.25%
Create a Home Valuation Report for This Property
The Home Valuation Report is an in-depth analysis detailing your home's value as well as a comparison with similar homes in the area
Home Values in the Area
Average Home Value in this Area
Purchase History
| Date | Buyer | Sale Price | Title Company |
|---|---|---|---|
| Le Toan P | -- | None Available | |
| Le Toan P | -- | First American Title Co | |
| Le Toan P | -- | Chicago Title Co |
Source: Public Records
Mortgage History
| Date | Status | Borrower | Loan Amount |
|---|---|---|---|
| Open | Le Toan P | $556,000 | |
| Closed | Le Toan P | $600,000 |
Source: Public Records
Tax History Compared to Growth
Tax History
| Year | Tax Paid | Tax Assessment Tax Assessment Total Assessment is a certain percentage of the fair market value that is determined by local assessors to be the total taxable value of land and additions on the property. | Land | Improvement |
|---|---|---|---|---|
| 2025 | $22,835 | $1,808,199 | $1,265,746 | $542,453 |
| 2024 | $22,835 | $1,772,745 | $1,240,928 | $531,817 |
| 2023 | $22,636 | $1,737,987 | $1,216,597 | $521,390 |
| 2022 | $22,225 | $1,703,910 | $1,192,743 | $511,167 |
| 2021 | $21,914 | $1,670,501 | $1,169,356 | $501,145 |
| 2020 | $21,599 | $1,653,373 | $1,157,366 | $496,007 |
| 2019 | $20,747 | $1,620,955 | $1,134,673 | $486,282 |
| 2018 | $20,346 | $1,589,173 | $1,112,425 | $476,748 |
| 2017 | $20,079 | $1,558,013 | $1,090,613 | $467,400 |
| 2016 | $18,917 | $1,527,465 | $1,069,229 | $458,236 |
| 2015 | $18,749 | $1,504,522 | $1,053,169 | $451,353 |
| 2014 | $18,309 | $1,475,051 | $1,032,539 | $442,512 |
Source: Public Records
Map
Nearby Homes
- 1577 Maurice Ln
- 1510 Greene Dr
- 12584 Paseo Flores
- 1957 Colusa Way
- 5043 Le Miccine Terrace Unit 76
- 12140 Woodside Dr
- 5635 W Walbrook Dr
- 2090 Elmgrove Ln
- 1367 Cordelia Ave
- 11315 Cottonwood Place Unit 39-09 Plan 3
- 11240 Cottonwood Place Unit 38-08 Plan 3
- 11220 Cottonwood Place Unit 36-08 Plan 2
- 11210 Cottonwood Place Unit 35-08 Plan 4
- 11155 Maple Place Unit 34-07 Plan 3
- 11145 Maple Place Unit 33-07 Plan 2
- 11125 Maple Place Unit 31-07 Plan 2
- 11115 Maple Place Unit 30-07
- Plan 2 at The Elms
- Plan 3 at The Elms
- Plan 4 at The Elms
- 18735 Cabernet Dr
- 18751 Cabernet Dr
- 18748 Cabernet Dr
- 18759 Cabernet Dr
- 18727 Cabernet Dr
- 18734 Cabernet Dr
- 18711 San Palo Ct
- 18754 Cabernet Dr
- 18728 Cabernet Dr
- 18767 Cabernet Dr
- 18937 Cabernet Dr
- 18699 San Palo Ct
- 18766 Cabernet Dr
- 18945 Cabernet Dr
- 18929 Cabernet Dr
- 18670 San Palo Ct
- 12324 Lolly Dr
- 18775 Cabernet Dr
- 18687 San Palo Ct
- 18917 Cabernet Dr