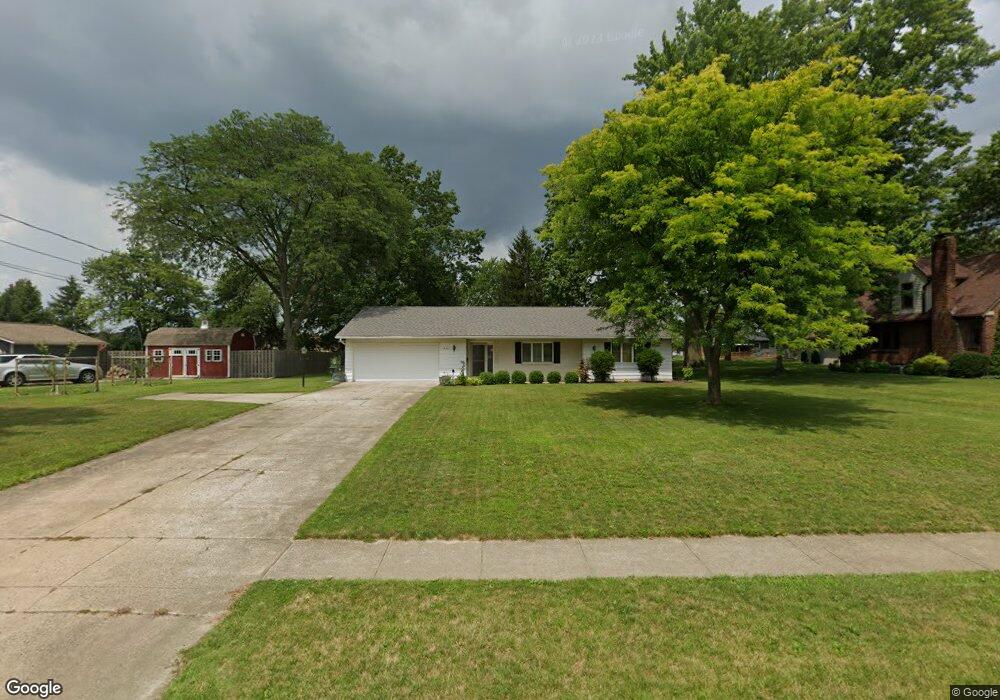
18760 Cook Ave Strongsville, OH 44136
Estimated Value: $268,740 - $293,000
2
Beds
2
Baths
1,796
Sq Ft
$155/Sq Ft
Est. Value
About This Home
This home is located at 18760 Cook Ave, Strongsville, OH 44136 and is currently estimated at $278,685, approximately $155 per square foot. 18760 Cook Ave is a home located in Cuyahoga County with nearby schools including Strongsville High School, Strongsville Academy, and Sts Joseph & John Interparochial School.
Ownership History
Date
Name
Owned For
Owner Type
Purchase Details
Closed on
Nov 3, 2011
Sold by
Donnellan Diane M
Bought by
Matheny Diane M
Current Estimated Value
Purchase Details
Closed on
Aug 25, 2011
Sold by
Doerk Susan
Bought by
Donnellan Diane M
Home Financials for this Owner
Home Financials are based on the most recent Mortgage that was taken out on this home.
Original Mortgage
$114,034
Interest Rate
4.5%
Mortgage Type
FHA
Purchase Details
Closed on
Dec 14, 2006
Sold by
Doerk Susan
Bought by
Doerk Susan
Purchase Details
Closed on
Jan 26, 2006
Sold by
Jardine Hazel
Bought by
Doerk Susan
Purchase Details
Closed on
Apr 27, 1976
Sold by
Duskey Stanley F and Duskey Anna F
Bought by
Jardine Hazel
Purchase Details
Closed on
Jan 1, 1975
Bought by
Duskey Stanley F and Duskey Anna F
Create a Home Valuation Report for This Property
The Home Valuation Report is an in-depth analysis detailing your home's value as well as a comparison with similar homes in the area
Home Values in the Area
Average Home Value in this Area
Purchase History
| Date | Buyer | Sale Price | Title Company |
|---|---|---|---|
| Matheny Diane M | -- | None Available | |
| Donnellan Diane M | $117,000 | Cleveland Home Title | |
| Doerk Susan | -- | Attorney | |
| Doerk Susan | -- | Attorney | |
| Jardine Hazel | $10,500 | -- | |
| Duskey Stanley F | -- | -- |
Source: Public Records
Mortgage History
| Date | Status | Borrower | Loan Amount |
|---|---|---|---|
| Previous Owner | Donnellan Diane M | $114,034 |
Source: Public Records
Tax History Compared to Growth
Tax History
| Year | Tax Paid | Tax Assessment Tax Assessment Total Assessment is a certain percentage of the fair market value that is determined by local assessors to be the total taxable value of land and additions on the property. | Land | Improvement |
|---|---|---|---|---|
| 2024 | $3,292 | $70,105 | $15,295 | $54,810 |
| 2023 | $3,616 | $57,750 | $12,320 | $45,430 |
| 2022 | $3,590 | $57,750 | $12,320 | $45,430 |
| 2021 | $3,561 | $57,750 | $12,320 | $45,430 |
| 2020 | $3,660 | $52,500 | $11,200 | $41,300 |
| 2019 | $3,552 | $150,000 | $32,000 | $118,000 |
| 2018 | $3,115 | $52,500 | $11,200 | $41,300 |
| 2017 | $3,061 | $46,140 | $9,770 | $36,370 |
| 2016 | $3,036 | $46,140 | $9,770 | $36,370 |
| 2015 | $3,079 | $46,140 | $9,770 | $36,370 |
| 2014 | $3,079 | $46,140 | $9,770 | $36,370 |
Source: Public Records
Map
Nearby Homes
- 19160 Wheelers Ln
- 18630 Shurmer Rd
- 14112 Settlers Way
- 19620 Porters Ln Unit 15F
- 19513 Lunn Rd
- 18162 Fawn Cir
- 17069 Partridge Dr
- 20078 Trapper Trail
- 17289 Akita Ct Unit 4508
- 13099 Olympus Way
- 13156 Olympus Way
- 13066 Olympus Way
- 13513 Suncrest Ct
- 18248 Meadow Ln
- 19311 Bradford Ct
- 17809 Cliffside Dr Unit 4926
- 12539 Olympus Way
- 15279 Walnut Creek Dr
- 19297 Lauren Way
- 14703 Lenox Dr Unit 103
- 18690 Cook Ave
- 18784 Cook Ave
- 14432 Pearlview Dr
- 18648 Cook Ave
- 18822 Cook Ave
- 18655 Bishop Ln
- 18739 Cook Ave
- 18604 Cook Ave
- 18691 Cook Ave
- 18781 Cook Ave
- 18639 Bishop Ln
- 14424 Pearlview Dr
- 18649 Cook Ave
- 18827 Cook Ave
- 18600 Cook Ave
- 18603 Bishop Ln
- 14416 Pearlview Dr
- 14407 Pearl Rd
- 18603 Cook Ave
- 18579 Bishop Ln