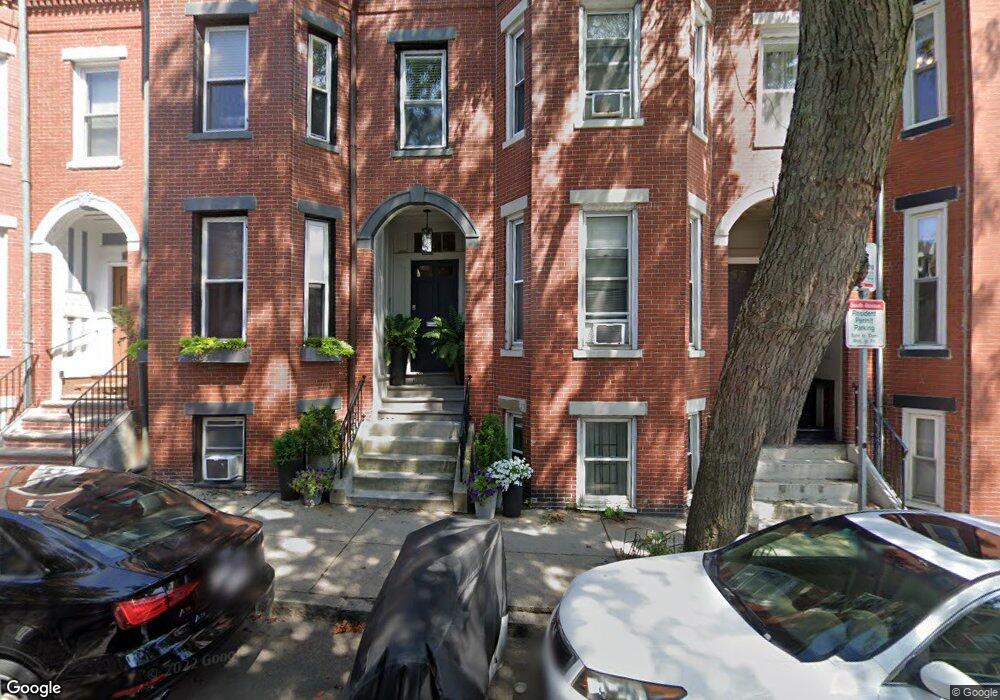
188 I St Unit 3 Boston, MA 02127
South Boston NeighborhoodEstimated Value: $547,356 - $582,000
1
Bed
1
Bath
642
Sq Ft
$885/Sq Ft
Est. Value
About This Home
This home is located at 188 I St Unit 3, Boston, MA 02127 and is currently estimated at $568,089, approximately $884 per square foot. 188 I St Unit 3 is a home located in Suffolk County with nearby schools including Bridge Boston Charter School, Edward M. Kennedy Academy for Health Careers, and Torit Montessori School.
Ownership History
Date
Name
Owned For
Owner Type
Purchase Details
Closed on
Nov 8, 1996
Sold by
Fnma
Bought by
Branchini Gail M
Current Estimated Value
Home Financials for this Owner
Home Financials are based on the most recent Mortgage that was taken out on this home.
Original Mortgage
$41,300
Outstanding Balance
$4,074
Interest Rate
8.1%
Mortgage Type
Purchase Money Mortgage
Estimated Equity
$564,015
Create a Home Valuation Report for This Property
The Home Valuation Report is an in-depth analysis detailing your home's value as well as a comparison with similar homes in the area
Home Values in the Area
Average Home Value in this Area
Purchase History
| Date | Buyer | Sale Price | Title Company |
|---|---|---|---|
| Branchini Gail M | $59,000 | -- |
Source: Public Records
Mortgage History
| Date | Status | Borrower | Loan Amount |
|---|---|---|---|
| Open | Branchini Gail M | $41,300 |
Source: Public Records
Tax History Compared to Growth
Tax History
| Year | Tax Paid | Tax Assessment Tax Assessment Total Assessment is a certain percentage of the fair market value that is determined by local assessors to be the total taxable value of land and additions on the property. | Land | Improvement |
|---|---|---|---|---|
| 2025 | $5,408 | $467,000 | $0 | $467,000 |
| 2024 | $5,461 | $501,000 | $0 | $501,000 |
| 2023 | $5,272 | $490,900 | $0 | $490,900 |
| 2022 | $5,134 | $471,900 | $0 | $471,900 |
| 2021 | $4,936 | $462,600 | $0 | $462,600 |
| 2020 | $4,420 | $418,600 | $0 | $418,600 |
| 2019 | $4,124 | $391,300 | $0 | $391,300 |
| 2018 | $3,905 | $372,600 | $0 | $372,600 |
| 2017 | $3,688 | $348,300 | $0 | $348,300 |
| 2016 | $3,614 | $328,500 | $0 | $328,500 |
| 2015 | $3,841 | $317,200 | $0 | $317,200 |
| 2014 | $3,563 | $283,200 | $0 | $283,200 |
Source: Public Records
Map
Nearby Homes
- 493 E 7th St
- 527 E 7th St Unit 5
- 527 E 7th St Unit 4
- 527 E 7th St Unit 2
- 521 E 8th St Unit 6
- 178 H St
- 511 E 8th St Unit A
- 170 H St
- 551 E 7th St
- 479 E 6th St
- 511 E 5th St Unit 3F
- 511 E 5th St Unit PH
- 511 E 5th St Unit 3R
- 511 E 5th St Unit 2R
- 317 K St
- 550 E 5th St
- 449 E 5th St
- 594 E 7th St
- 430 E 8th St
- 560 E 5th St Unit 2