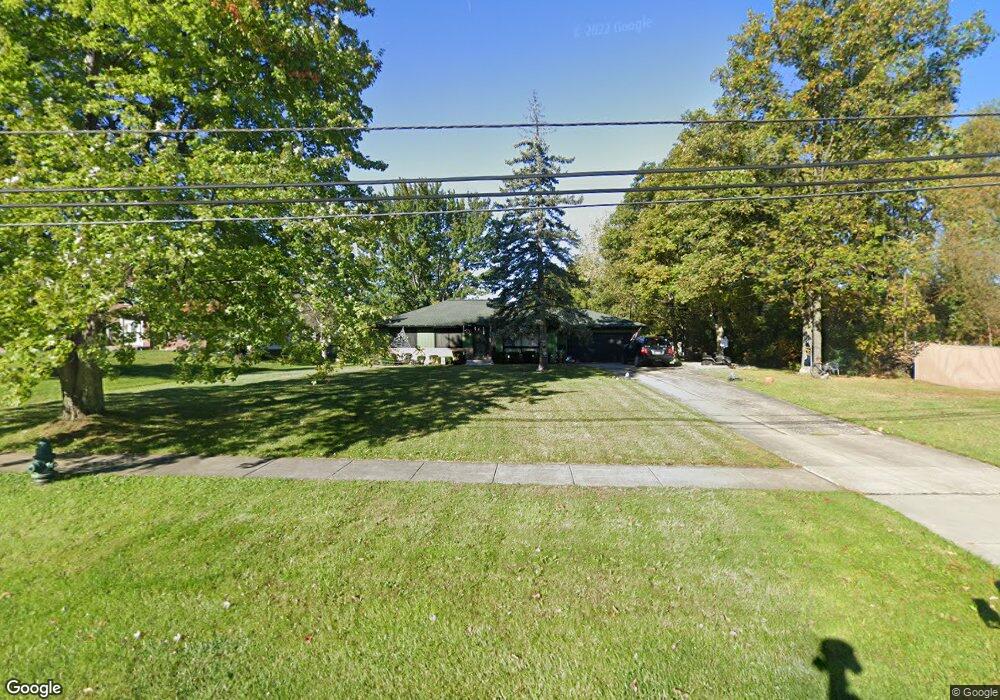
18800 W 130th St Strongsville, OH 44136
Estimated Value: $231,000 - $294,000
3
Beds
1
Bath
1,148
Sq Ft
$223/Sq Ft
Est. Value
About This Home
This home is located at 18800 W 130th St, Strongsville, OH 44136 and is currently estimated at $256,105, approximately $223 per square foot. 18800 W 130th St is a home located in Cuyahoga County with nearby schools including Strongsville High School and Royal Redeemer Lutheran School.
Ownership History
Date
Name
Owned For
Owner Type
Purchase Details
Closed on
Jul 22, 2011
Sold by
Quallich Michael A
Bought by
Farkas Jarrod A and Farkas Amy M
Current Estimated Value
Home Financials for this Owner
Home Financials are based on the most recent Mortgage that was taken out on this home.
Original Mortgage
$93,071
Outstanding Balance
$64,362
Interest Rate
4.62%
Mortgage Type
FHA
Estimated Equity
$191,743
Purchase Details
Closed on
Nov 20, 2009
Sold by
Wolny Lawrence A and Wolny Dennis J
Bought by
Quallich Michael A
Home Financials for this Owner
Home Financials are based on the most recent Mortgage that was taken out on this home.
Original Mortgage
$98,188
Interest Rate
4.95%
Mortgage Type
FHA
Purchase Details
Closed on
May 7, 1999
Sold by
Estate Of Violet L Wolny
Bought by
Bennett Lanny D and Bennett Timothy C
Purchase Details
Closed on
Jan 12, 1982
Bought by
Wolny Walter L
Purchase Details
Closed on
Jan 1, 1975
Bought by
Wolny Rose Marie
Create a Home Valuation Report for This Property
The Home Valuation Report is an in-depth analysis detailing your home's value as well as a comparison with similar homes in the area
Home Values in the Area
Average Home Value in this Area
Purchase History
| Date | Buyer | Sale Price | Title Company |
|---|---|---|---|
| Farkas Jarrod A | $97,000 | Chicago Title Insurance Co | |
| Quallich Michael A | $100,000 | Newman Title | |
| Bennett Lanny D | -- | -- | |
| Wolny Walter L | -- | -- | |
| Stanley D Scheetz Trs | -- | -- | |
| Wolny Rose Marie | -- | -- |
Source: Public Records
Mortgage History
| Date | Status | Borrower | Loan Amount |
|---|---|---|---|
| Open | Farkas Jarrod A | $93,071 | |
| Previous Owner | Quallich Michael A | $98,188 |
Source: Public Records
Tax History Compared to Growth
Tax History
| Year | Tax Paid | Tax Assessment Tax Assessment Total Assessment is a certain percentage of the fair market value that is determined by local assessors to be the total taxable value of land and additions on the property. | Land | Improvement |
|---|---|---|---|---|
| 2024 | $3,086 | $65,730 | $26,250 | $39,480 |
| 2023 | $3,009 | $48,060 | $30,380 | $17,680 |
| 2022 | $2,987 | $48,060 | $30,380 | $17,680 |
| 2021 | $2,964 | $48,060 | $30,380 | $17,680 |
| 2020 | $2,938 | $42,140 | $26,640 | $15,510 |
| 2019 | $2,852 | $120,400 | $76,100 | $44,300 |
| 2018 | $2,588 | $42,140 | $26,640 | $15,510 |
| 2017 | $2,234 | $33,680 | $21,740 | $11,940 |
| 2016 | $2,216 | $33,680 | $21,740 | $11,940 |
| 2015 | $2,247 | $33,680 | $21,740 | $11,940 |
| 2014 | $2,247 | $33,680 | $21,740 | $11,940 |
Source: Public Records
Map
Nearby Homes
- 13335 Tradewinds Dr
- 13448 Compass Point Dr
- 19252 Hidden Woods Ln
- 18680 Bennett Rd
- 14132 Walking Stick Way
- 18987 Laurell Cir
- 19813 Cross Trail S
- 106 Briarleigh Dr
- 14558 Drake Rd
- 11438 Drake Rd
- 14985 Camden Cir
- 11886 Friar Post
- 3137 Blackburn Ln
- 15188 Trails Landing
- 266 Bettie Ln
- 19694 Benbow Rd
- 19740 Benbow Rd
- 10244 Hidden Valley Dr
- 15604-REAR Boston Rd
- 2882 Marion Pkwy
- 18836 W 130th St
- 13184 Cheryl Dr
- 17771 W 130th St
- 13175 Long Boat Cir
- 17761 W 130th St
- 13212 Cheryl Dr
- 17781 W 130th St
- 13111 Long Boat Cir
- 17751 W 130th St
- 18908 W 130th St
- 17791 W 130th St
- 13079 Long Boat Cir
- 13240 Cheryl Dr
- 17741 W 130th St
- 13207 Long Boat Cir
- 13047 Long Boat Cir
- 18944 W 130th St
- 13205 Cheryl Dr
- 17801 W 130th St
- 17731 W 130th St