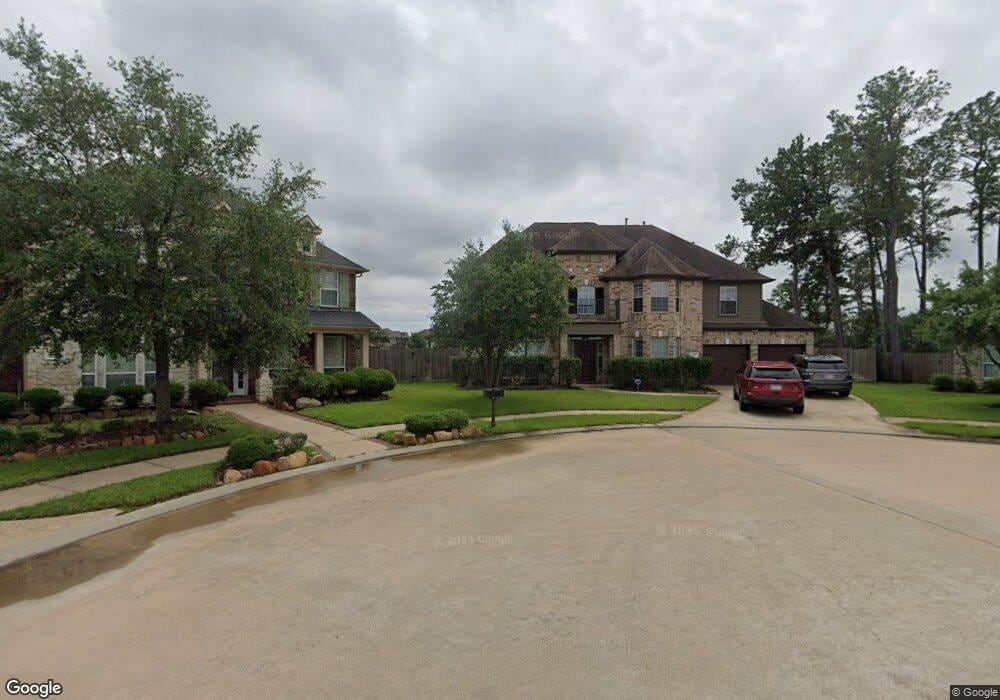
18803 Fortrose Garden Ct Tomball, TX 77377
Northpointe NeighborhoodEstimated Value: $608,058 - $688,000
5
Beds
5
Baths
4,478
Sq Ft
$147/Sq Ft
Est. Value
About This Home
This home is located at 18803 Fortrose Garden Ct, Tomball, TX 77377 and is currently estimated at $657,515, approximately $146 per square foot. 18803 Fortrose Garden Ct is a home located in Harris County with nearby schools including Canyon Pointe Elementary School, Oakcrest Intermediate School, and Tomball Memorial High School.
Ownership History
Date
Name
Owned For
Owner Type
Purchase Details
Closed on
Nov 3, 2011
Sold by
Fannie Mae
Bought by
Williams Adam Bruce and Williams Amy Louise
Current Estimated Value
Home Financials for this Owner
Home Financials are based on the most recent Mortgage that was taken out on this home.
Original Mortgage
$255,845
Outstanding Balance
$173,193
Interest Rate
3.87%
Mortgage Type
FHA
Estimated Equity
$484,322
Purchase Details
Closed on
Dec 7, 2010
Sold by
Williams Lynda and Williams Michael
Bought by
Federal National Mortgage Association
Purchase Details
Closed on
Apr 4, 2005
Sold by
D R Horton Emerald Ltd
Bought by
Williams Michael and Williams Lynda
Home Financials for this Owner
Home Financials are based on the most recent Mortgage that was taken out on this home.
Original Mortgage
$265,976
Interest Rate
5.75%
Mortgage Type
Fannie Mae Freddie Mac
Create a Home Valuation Report for This Property
The Home Valuation Report is an in-depth analysis detailing your home's value as well as a comparison with similar homes in the area
Home Values in the Area
Average Home Value in this Area
Purchase History
| Date | Buyer | Sale Price | Title Company |
|---|---|---|---|
| Williams Adam Bruce | -- | Texas American Title Company | |
| Federal National Mortgage Association | $274,289 | None Available | |
| Williams Michael | -- | Dhi Title |
Source: Public Records
Mortgage History
| Date | Status | Borrower | Loan Amount |
|---|---|---|---|
| Open | Williams Adam Bruce | $255,845 | |
| Previous Owner | Williams Michael | $265,976 |
Source: Public Records
Tax History Compared to Growth
Tax History
| Year | Tax Paid | Tax Assessment Tax Assessment Total Assessment is a certain percentage of the fair market value that is determined by local assessors to be the total taxable value of land and additions on the property. | Land | Improvement |
|---|---|---|---|---|
| 2025 | $11,300 | $534,792 | $101,379 | $433,413 |
| 2024 | $11,300 | $534,792 | $101,379 | $433,413 |
| 2023 | $11,300 | $612,198 | $101,379 | $510,819 |
| 2022 | $11,510 | $538,966 | $87,043 | $451,923 |
| 2021 | $10,928 | $390,770 | $66,562 | $324,208 |
| 2020 | $11,228 | $383,368 | $66,562 | $316,806 |
| 2019 | $11,449 | $379,902 | $52,226 | $327,676 |
| 2018 | $4,706 | $376,187 | $52,226 | $323,961 |
| 2017 | $11,040 | $361,625 | $52,226 | $309,399 |
| 2016 | $10,964 | $361,625 | $52,226 | $309,399 |
| 2015 | $9,256 | $361,625 | $52,226 | $309,399 |
| 2014 | $9,256 | $324,007 | $52,226 | $271,781 |
Source: Public Records
Map
Nearby Homes
- 18903 Danbridge Ct
- 12414 Montebello Manor Ln
- 18814 Emery Meadows Ln
- 18703 Summercliff Ln
- 18803 Dusty Rose Ln
- 12610 Baldwin Springs Ct
- 18522 Cascade Timbers Ln
- 12719 Rocky Briar Ln
- 12427 Point Arbor Ct
- 19006 Rustling Ridge Ln
- 18135 Gravenhurst Ln
- 19026 Rustling Ridge Ln
- 19114 Canyon Vista Ct
- 18603 Bridle Grove Ct
- 12623 Ember Village Ln
- 18402 Sierra Falls Ct
- 19307 Hillside Pasture Ln
- 20618 Yearling Pasture Ln
- 19243 Palfrey Prairie Trail
- 19219 Palfrey Prairie Trail
- 18806 Fortrose Garden Ct
- 18807 Fortrose Garden Ct
- 18811 Fortrose Garden Ct
- 18807 Oxley Ct
- 18811 Oxley Ct
- 18803 Oxley Ct
- 18802 Flaghorne Ct
- 18814 Fortrose Garden Ct
- 18815 Fortrose Garden Ct
- 18815 Oxley Ct
- 18806 Flaghorne Ct
- 18726 Aberdeen Hollow Ln
- 18723 Aberdeen Hollow Ln
- 18730 Peralta Hill Ln
- 18819 Fortrose Garden Ct
- 18810 Flaghorne Ct
- 18735 Peralta Hill Ln
- 18722 Aberdeen Hollow Ln
- 18802 Oxley Ct
- 18719 Aberdeen Hollow Ln