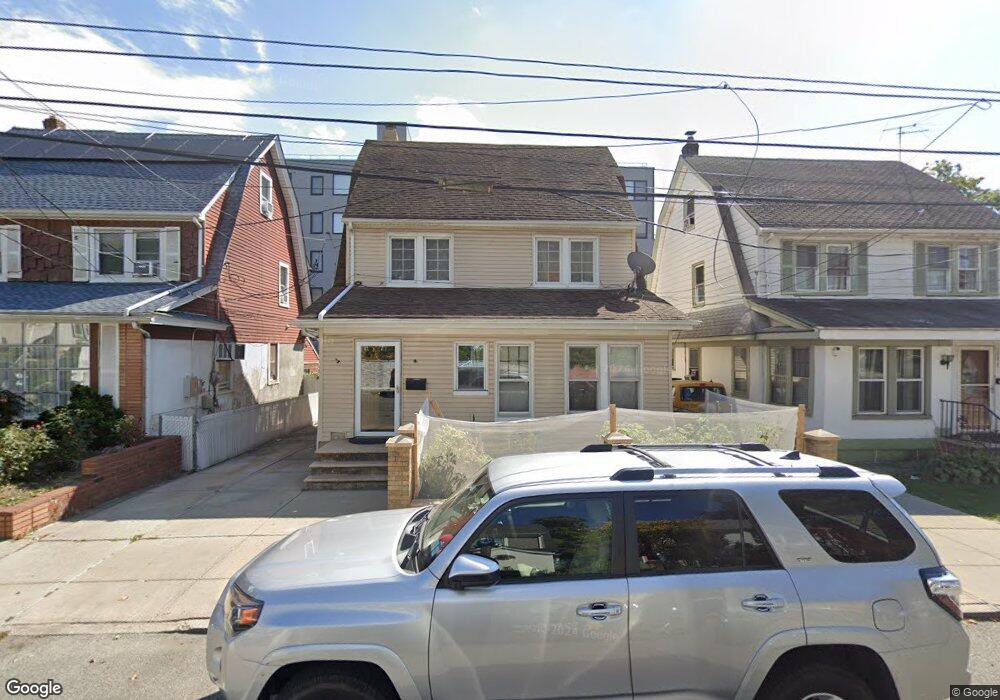
18806 87th Dr Hollis, NY 11423
Holliswood NeighborhoodEstimated Value: $809,000 - $967,000
--
Bed
--
Bath
1,825
Sq Ft
$487/Sq Ft
Est. Value
About This Home
This home is located at 18806 87th Dr, Hollis, NY 11423 and is currently estimated at $888,245, approximately $486 per square foot. 18806 87th Dr is a home located in Queens County with nearby schools including P.S. 35 Nathaniel Woodhull, I.S. 238 Susan B Anthony Academy, and The Wellspring Schools.
Ownership History
Date
Name
Owned For
Owner Type
Purchase Details
Closed on
Apr 29, 2002
Sold by
Mithani Rafiq and Noronha Clara N
Bought by
Sanchez Hernan
Current Estimated Value
Home Financials for this Owner
Home Financials are based on the most recent Mortgage that was taken out on this home.
Original Mortgage
$315,000
Interest Rate
6.8%
Purchase Details
Closed on
Nov 27, 2000
Sold by
Akinrinade Abinbola O
Bought by
Mithani Rafiq and Noronha Clara N
Home Financials for this Owner
Home Financials are based on the most recent Mortgage that was taken out on this home.
Original Mortgage
$220,000
Interest Rate
7.7%
Purchase Details
Closed on
Feb 11, 1999
Sold by
Mann Gurdip Singh and Mann Massa Singh
Bought by
Akinrinade Abimbola O
Home Financials for this Owner
Home Financials are based on the most recent Mortgage that was taken out on this home.
Original Mortgage
$225,631
Interest Rate
6.83%
Create a Home Valuation Report for This Property
The Home Valuation Report is an in-depth analysis detailing your home's value as well as a comparison with similar homes in the area
Home Values in the Area
Average Home Value in this Area
Purchase History
| Date | Buyer | Sale Price | Title Company |
|---|---|---|---|
| Sanchez Hernan | -- | -- | |
| Mithani Rafiq | $275,000 | Fidelity National Title | |
| Akinrinade Abimbola O | $234,000 | Stewart Title Insurance Co |
Source: Public Records
Mortgage History
| Date | Status | Borrower | Loan Amount |
|---|---|---|---|
| Previous Owner | Sanchez Hernan | $315,000 | |
| Previous Owner | Mithani Rafiq | $220,000 | |
| Previous Owner | Akinrinade Abimbola O | $225,631 |
Source: Public Records
Tax History Compared to Growth
Tax History
| Year | Tax Paid | Tax Assessment Tax Assessment Total Assessment is a certain percentage of the fair market value that is determined by local assessors to be the total taxable value of land and additions on the property. | Land | Improvement |
|---|---|---|---|---|
| 2025 | $8,256 | $42,854 | $12,699 | $30,155 |
| 2024 | $8,256 | $41,105 | $11,435 | $29,670 |
| 2023 | $8,204 | $40,846 | $11,994 | $28,852 |
| 2022 | $8,010 | $46,380 | $15,540 | $30,840 |
| 2021 | $7,966 | $49,620 | $15,540 | $34,080 |
| 2020 | $7,559 | $54,540 | $15,540 | $39,000 |
| 2019 | $7,166 | $47,640 | $15,540 | $32,100 |
| 2018 | $6,939 | $34,038 | $13,378 | $20,660 |
| 2017 | $6,816 | $33,437 | $14,629 | $18,808 |
| 2016 | $6,306 | $33,437 | $14,629 | $18,808 |
| 2015 | $3,631 | $29,760 | $17,280 | $12,480 |
| 2014 | $3,631 | $28,545 | $14,101 | $14,444 |
Source: Public Records
Map
Nearby Homes
- 8817 190th St
- 187-14 Wexford Terrace
- 8716 Palo Alto St
- 8702 188th St
- 19127 Foothill Ave
- 8684 188th St
- 8746 Chelsea St Unit 6E
- 8746 Chelsea St Unit 7H
- 8839 186th St
- 186-34 Henley Rd
- 88-22 186th St
- 8702 Chevy Chase St
- 8829 184th St
- 191-13 Jamaica Ave
- 85-24 Eton St
- 8511 Eton St
- 90-19 185th St
- 90-21 185th St
- 19633 Foothill Ave
- 196-33 Foothill Ave
- 18810 87th Dr
- 188-10 87th Dr
- 18802 87th Dr
- 18814 87th Dr
- 18811 Hillside Ave
- 18818 87th Dr
- 188-11 Hillside Ave Unit 514
- 188-11 Hillside Ave Unit 210
- 188-11 Hillside Ave Unit 701
- 188-11 Hillside Ave Unit 414
- 188-11 Hillside Ave Unit 301
- 188-11 Hillside Ave Unit 611
- 188-11 Hillside Ave Unit 216
- 188-11 Hillside Ave Unit 408
- 188-11 Hillside Ave Unit 303
- 188-07 87th Dr
- 18807 87th Dr
- 18801 87th Dr
- 18811 87th Dr
- 18822 87th Dr