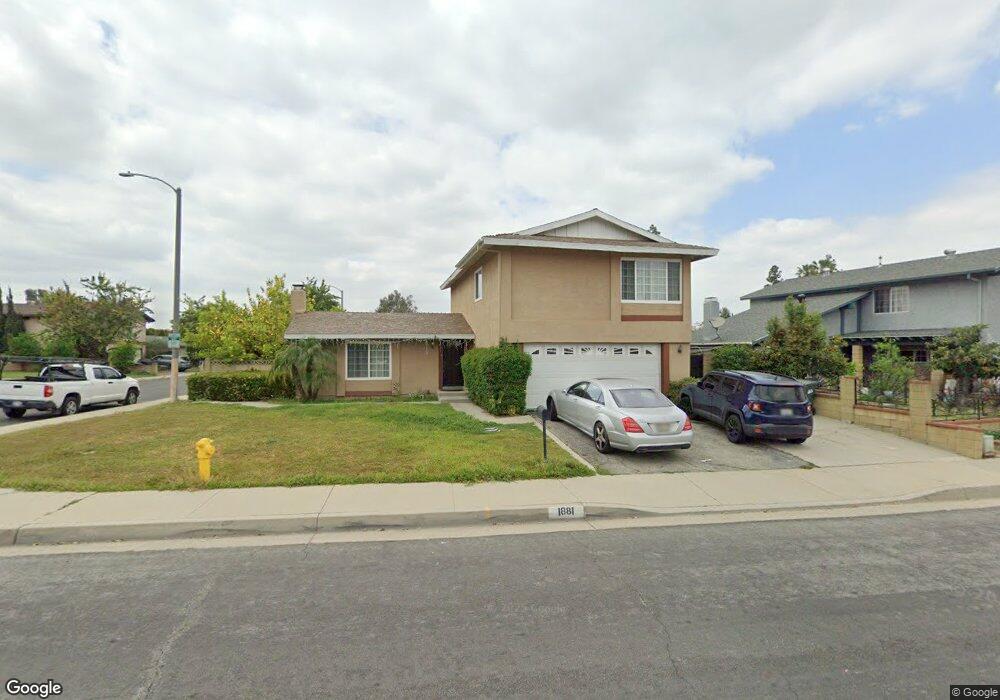
1881 Bluehaven Dr Rowland Heights, CA 91748
Estimated Value: $893,639 - $977,000
4
Beds
3
Baths
1,606
Sq Ft
$584/Sq Ft
Est. Value
About This Home
This home is located at 1881 Bluehaven Dr, Rowland Heights, CA 91748 and is currently estimated at $937,660, approximately $583 per square foot. 1881 Bluehaven Dr is a home located in Los Angeles County with nearby schools including Shelyn Elementary School, Alvarado Intermediate School, and John A. Rowland High School.
Ownership History
Date
Name
Owned For
Owner Type
Purchase Details
Closed on
Jan 27, 2003
Sold by
Oshiro David O and Oshiro Melissa M
Bought by
Penasales Carolina
Current Estimated Value
Home Financials for this Owner
Home Financials are based on the most recent Mortgage that was taken out on this home.
Original Mortgage
$287,850
Interest Rate
9.5%
Purchase Details
Closed on
Jun 29, 2000
Sold by
Oshiro George O and Oshiro Margie L
Bought by
Oshiro David O and Oshiro Melissa M
Home Financials for this Owner
Home Financials are based on the most recent Mortgage that was taken out on this home.
Original Mortgage
$165,645
Interest Rate
8.11%
Mortgage Type
FHA
Purchase Details
Closed on
Dec 31, 1994
Sold by
Oshiro Burton M
Bought by
Oshiro George Osamu and Oshiro Margie Lyn
Home Financials for this Owner
Home Financials are based on the most recent Mortgage that was taken out on this home.
Original Mortgage
$33,140
Interest Rate
8.11%
Create a Home Valuation Report for This Property
The Home Valuation Report is an in-depth analysis detailing your home's value as well as a comparison with similar homes in the area
Home Values in the Area
Average Home Value in this Area
Purchase History
| Date | Buyer | Sale Price | Title Company |
|---|---|---|---|
| Penasales Carolina | $303,000 | Chicago | |
| Penasales Carolina | -- | Chicago | |
| Oshiro David O | $185,000 | South Coast Title Company | |
| Oshiro George Osamu | -- | California Counties Title Co |
Source: Public Records
Mortgage History
| Date | Status | Borrower | Loan Amount |
|---|---|---|---|
| Previous Owner | Penasales Carolina | $287,850 | |
| Previous Owner | Oshiro David O | $165,645 | |
| Previous Owner | Oshiro George Osamu | $33,140 |
Source: Public Records
Tax History Compared to Growth
Tax History
| Year | Tax Paid | Tax Assessment Tax Assessment Total Assessment is a certain percentage of the fair market value that is determined by local assessors to be the total taxable value of land and additions on the property. | Land | Improvement |
|---|---|---|---|---|
| 2025 | $5,613 | $438,823 | $268,945 | $169,878 |
| 2024 | $5,613 | $430,220 | $263,672 | $166,548 |
| 2023 | $5,427 | $421,785 | $258,502 | $163,283 |
| 2022 | $5,305 | $413,516 | $253,434 | $160,082 |
| 2021 | $5,213 | $405,409 | $248,465 | $156,944 |
| 2019 | $5,055 | $393,387 | $241,097 | $152,290 |
| 2018 | $4,857 | $385,674 | $236,370 | $149,304 |
| 2016 | $4,666 | $370,700 | $227,193 | $143,507 |
| 2015 | $4,590 | $365,133 | $223,781 | $141,352 |
| 2014 | $4,581 | $357,982 | $219,398 | $138,584 |
Source: Public Records
Map
Nearby Homes
- 1703 Hollandale Ave
- 1953 Camwood Ave
- 1919 Brea Canyon Cut-Off Rd
- 19527 Cronin Dr
- 2147 Wind River Ln
- 2189 Wind River Ln
- 2366 Pepperdale Dr
- 1337 Brea Canyon Cutoff Rd
- 1560 S Otterbein Ave Unit 44
- 1560 S Otterbein Ave Unit 153
- 1560 S Otterbein Ave Unit 113
- 1560 S Otterbein Ave Unit 170
- 1560 Otterbein Ave Unit 8
- 1560 Otterbein Ave Unit 12
- 2350 Robert Rd
- 20043 Emerald Meadow Dr
- 19717 Katrine Cir
- 19519 Greenwillow Ln
- 2251 Cascade Way
- 20122 Candleflame Ct
- 1871 Bluehaven Dr
- 1871 Blue Haven Dr
- 1874 Ybarra Dr
- 1863 Bluehaven Dr
- 1868 Ybarra Dr
- 19618 Springport Dr
- 19612 Springport Dr
- 1880 Bluehaven Dr
- 1874 Bluehaven Dr
- 1886 Bluehaven Dr
- 19606 Springport Dr
- 1862 Ybarra Dr
- 1855 Bluehaven Dr
- 1868 Bluehaven Dr
- 1904 Bluehaven Dr
- 19560 Springport Dr
- 1862 Bluehaven Dr
- 1856 Ybarra Dr
- 19615 Nacora St
- 19609 Nacora St