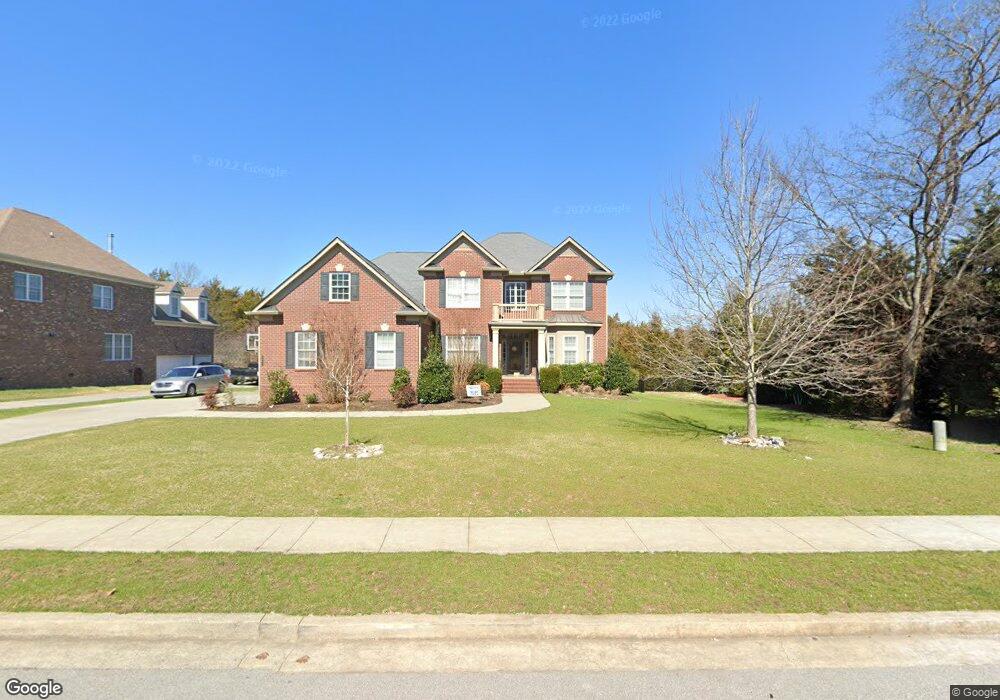
1881 Erlinger Dr Nolensville, TN 37135
Estimated Value: $1,120,652 - $1,148,000
--
Bed
1
Bath
3,536
Sq Ft
$322/Sq Ft
Est. Value
About This Home
This home is located at 1881 Erlinger Dr, Nolensville, TN 37135 and is currently estimated at $1,139,913, approximately $322 per square foot. 1881 Erlinger Dr is a home located in Williamson County with nearby schools including Sunset Elementary School, Sunset Middle School, and Nolensville High School.
Ownership History
Date
Name
Owned For
Owner Type
Purchase Details
Closed on
Mar 5, 2013
Sold by
Boualaphanh Sailom and Boualaphanh Milikan M
Bought by
Boualaphanh Sailom and Boualaphanh Malikan P
Current Estimated Value
Home Financials for this Owner
Home Financials are based on the most recent Mortgage that was taken out on this home.
Original Mortgage
$431,615
Outstanding Balance
$303,807
Interest Rate
3.56%
Mortgage Type
VA
Estimated Equity
$836,106
Purchase Details
Closed on
Jul 17, 2009
Sold by
Newmark Homes Lp
Bought by
Boualaphanh Sailom and Boualaphanh Milikan M
Home Financials for this Owner
Home Financials are based on the most recent Mortgage that was taken out on this home.
Original Mortgage
$438,375
Interest Rate
5.53%
Mortgage Type
VA
Purchase Details
Closed on
Sep 5, 2007
Sold by
Cates Kottas Development Llc
Bought by
Newmark Homes Lp
Create a Home Valuation Report for This Property
The Home Valuation Report is an in-depth analysis detailing your home's value as well as a comparison with similar homes in the area
Home Values in the Area
Average Home Value in this Area
Purchase History
| Date | Buyer | Sale Price | Title Company |
|---|---|---|---|
| Boualaphanh Sailom | -- | Rudy Title And Escrow | |
| Boualaphanh Sailom | $442,000 | Rudy Title & Escrow | |
| Newmark Homes Lp | $367,495 | Overland Title Co |
Source: Public Records
Mortgage History
| Date | Status | Borrower | Loan Amount |
|---|---|---|---|
| Open | Boualaphanh Sailom | $431,615 | |
| Closed | Boualaphanh Sailom | $438,375 |
Source: Public Records
Tax History Compared to Growth
Tax History
| Year | Tax Paid | Tax Assessment Tax Assessment Total Assessment is a certain percentage of the fair market value that is determined by local assessors to be the total taxable value of land and additions on the property. | Land | Improvement |
|---|---|---|---|---|
| 2025 | $3,755 | $277,000 | $87,500 | $189,500 |
| 2024 | $3,755 | $173,025 | $45,000 | $128,025 |
| 2023 | $3,755 | $173,025 | $45,000 | $128,025 |
| 2022 | $3,755 | $173,025 | $45,000 | $128,025 |
| 2021 | $3,755 | $173,025 | $45,000 | $128,025 |
| 2020 | $3,509 | $139,800 | $28,750 | $111,050 |
| 2019 | $3,314 | $139,800 | $28,750 | $111,050 |
| 2018 | $3,216 | $139,800 | $28,750 | $111,050 |
| 2017 | $3,188 | $139,800 | $28,750 | $111,050 |
| 2016 | $0 | $139,800 | $28,750 | $111,050 |
| 2015 | -- | $115,375 | $23,750 | $91,625 |
| 2014 | -- | $115,375 | $23,750 | $91,625 |
Source: Public Records
Map
Nearby Homes
- 2510 Benington Place
- 2029 Universe Ct
- 2032 Universe Ct
- 1818 Eaves Ct
- 2029 Delaware Dr
- 2025 Delaware Dr
- 1969 Ashburn Ct
- 2713 Bering Ct
- 2004 Vail Trace
- 9905 Elland Rd
- Devonshire II Plan at Telluride - Manor
- Westchester II Plan at Telluride - Manor
- Southhampton Plan at Telluride - Manor
- St. Andrews III Plan at Telluride - Manor
- Nottingham Plan at Telluride - Manor
- Glen Abbey III Plan at Telluride - Manor
- 2020 Vail Trace
- 2203 Carouth Ct
- 2025 Vail Trace
- 2033 Vail Trace
- 1885 Erlinger Dr
- 1877 Erlinger Dr
- 2205 Steel Ct
- 1889 Erlinger Dr
- 2209 Steel Ct
- 1880 Erlinger Dr
- 1884 Erlinger Dr
- 1876 Erlinger Dr
- 2540 Benington Place
- 1500 Pumpkin Ridge Ct
- 1496 Pumpkin Ridge Ct
- 2213 Steel Ct
- 1504 Pumpkin Ridge Ct
- 2200 Steel Ct
- 2204 Steel Ct
- 1492 Pumpkin Ridge Ct
- 2212 Steel Ct
- 1508 Pumpkin Ridge Ct
- 2208 Steel Ct
- 2548 Benington Place