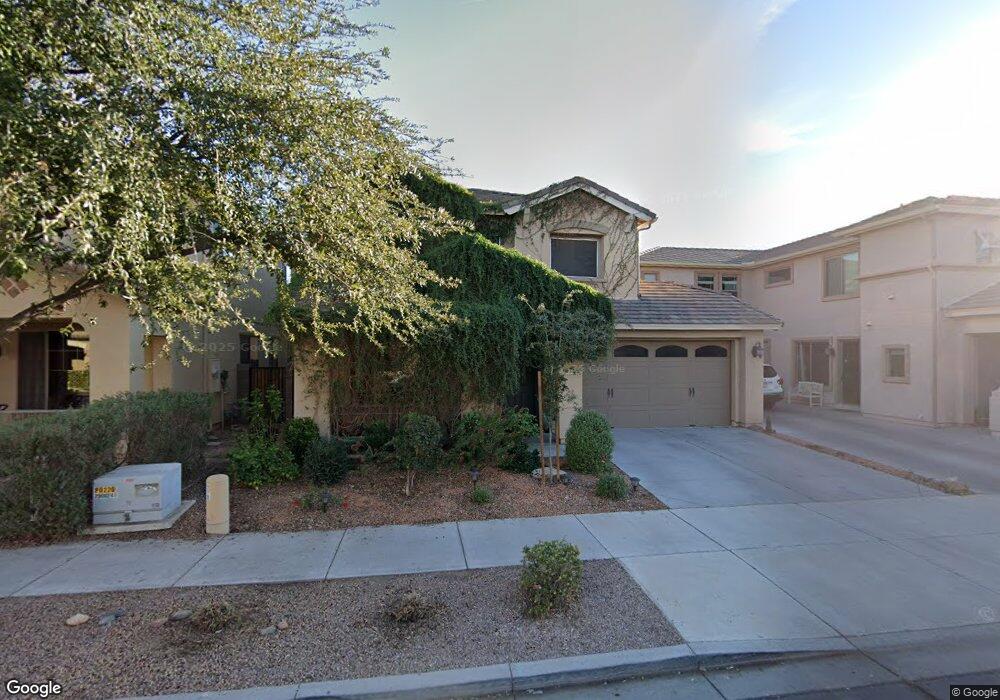
18845 E Swan Dr Queen Creek, AZ 85142
Cortina NeighborhoodEstimated Value: $461,293 - $502,000
--
Bed
4
Baths
2,308
Sq Ft
$207/Sq Ft
Est. Value
About This Home
This home is located at 18845 E Swan Dr, Queen Creek, AZ 85142 and is currently estimated at $478,823, approximately $207 per square foot. 18845 E Swan Dr is a home located in Maricopa County with nearby schools including Cortina Elementary School, Sossaman Middle School, and Higley High School.
Ownership History
Date
Name
Owned For
Owner Type
Purchase Details
Closed on
Sep 27, 2019
Sold by
Cai Yaguang and Cai Gao Family Trust
Bought by
Cai Yaguang and Gao Minghui
Current Estimated Value
Purchase Details
Closed on
Aug 28, 2007
Sold by
Cai Yaguang and Gao Minghui
Bought by
Cai Yaguang
Home Financials for this Owner
Home Financials are based on the most recent Mortgage that was taken out on this home.
Original Mortgage
$205,000
Outstanding Balance
$128,656
Interest Rate
6.4%
Mortgage Type
New Conventional
Estimated Equity
$350,167
Purchase Details
Closed on
Jun 5, 2007
Sold by
Fulton Homes Sales Corp
Bought by
Cai Yaguang and Gao Minghui
Home Financials for this Owner
Home Financials are based on the most recent Mortgage that was taken out on this home.
Original Mortgage
$204,727
Interest Rate
6.16%
Mortgage Type
New Conventional
Create a Home Valuation Report for This Property
The Home Valuation Report is an in-depth analysis detailing your home's value as well as a comparison with similar homes in the area
Home Values in the Area
Average Home Value in this Area
Purchase History
| Date | Buyer | Sale Price | Title Company |
|---|---|---|---|
| Cai Yaguang | -- | None Available | |
| Cai Yaguang | -- | Camelback Title Agency Llc | |
| Cai Yaguang | $255,909 | The Talon Group Tempe Supers | |
| Fulton Homes Sales Corp | $207,303 | The Talon Group Tempe Supers |
Source: Public Records
Mortgage History
| Date | Status | Borrower | Loan Amount |
|---|---|---|---|
| Open | Cai Yaguang | $205,000 | |
| Closed | Cai Yaguang | $204,727 |
Source: Public Records
Tax History Compared to Growth
Tax History
| Year | Tax Paid | Tax Assessment Tax Assessment Total Assessment is a certain percentage of the fair market value that is determined by local assessors to be the total taxable value of land and additions on the property. | Land | Improvement |
|---|---|---|---|---|
| 2025 | $1,938 | $24,270 | -- | -- |
| 2024 | $2,095 | $23,114 | -- | -- |
| 2023 | $2,095 | $36,480 | $7,290 | $29,190 |
| 2022 | $2,023 | $27,080 | $5,410 | $21,670 |
| 2021 | $2,065 | $24,950 | $4,990 | $19,960 |
| 2020 | $2,096 | $23,660 | $4,730 | $18,930 |
| 2019 | $2,110 | $21,460 | $4,290 | $17,170 |
| 2018 | $2,096 | $19,880 | $3,970 | $15,910 |
| 2017 | $2,017 | $17,370 | $3,470 | $13,900 |
| 2016 | $2,030 | $17,210 | $3,440 | $13,770 |
| 2015 | $1,769 | $16,600 | $3,320 | $13,280 |
Source: Public Records
Map
Nearby Homes
- 18820 E Superstition Dr
- 18862 E Lark Dr
- 18838 E Lark Dr
- 18811 E Pelican Ct
- 19013 E Seagull Dr
- 19035 E Pelican Dr
- 19636 S 189th St
- 19009 E Cattle Dr
- 19172 E Seagull Dr
- 18678 E Cardinal Way
- 18614 E Oriole Way
- 18625 E Raven Dr
- 19903 S 187th Dr
- 4224 S Fireside Ct
- 19837 S 192nd Place
- 4756 E Ironhorse Rd
- 20022 S 192nd Place
- 4746 E Buckboard Ct
- 20017 S 192nd Place
- 4254 S Winter Ln
- 18851 E Swan Dr
- 18833 E Swan Dr
- 18827 E Swan Dr
- 18863 E Swan Dr
- 18842 E Swan Dr
- 18848 E Swan Dr
- 18854 E Swan Dr
- 18874 E Kingbird Dr
- 18862 E Kingbird Dr
- 18821 E Swan Dr
- 18860 E Swan Dr
- 18869 E Swan Dr
- 18886 E Kingbird Dr
- 18850 E Kingbird Dr
- 18824 E Swan Dr
- 18864 E Swan Dr
- 18839 E Seagull Dr
- 18845 E Seagull Dr
- 18845 E Seagull Dr Unit 37
- 18815 E Swan Dr