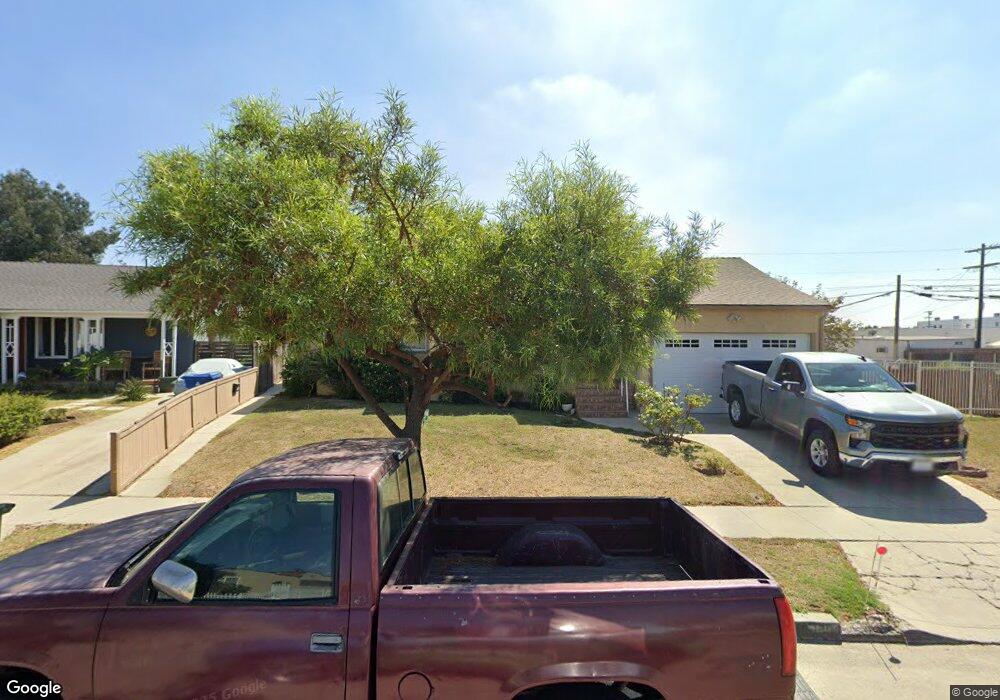
1886 S Curson Ave Los Angeles, CA 90019
Mid-City NeighborhoodEstimated Value: $1,213,000 - $1,556,000
3
Beds
2
Baths
1,609
Sq Ft
$885/Sq Ft
Est. Value
About This Home
This home is located at 1886 S Curson Ave, Los Angeles, CA 90019 and is currently estimated at $1,423,333, approximately $884 per square foot. 1886 S Curson Ave is a home located in Los Angeles County with nearby schools including Saturn Street Elementary School, Alexander Hamilton Senior High School, and New Los Angeles Charter.
Ownership History
Date
Name
Owned For
Owner Type
Purchase Details
Closed on
Nov 30, 2018
Sold by
Blakley Barbara A and Blakley Richard Michael
Bought by
Blakley Barbara and Barbara Blakley Family Trust
Current Estimated Value
Home Financials for this Owner
Home Financials are based on the most recent Mortgage that was taken out on this home.
Original Mortgage
$222,700
Outstanding Balance
$196,216
Interest Rate
4.9%
Mortgage Type
New Conventional
Estimated Equity
$1,227,117
Purchase Details
Closed on
Dec 23, 2017
Sold by
Blakley Barbara
Bought by
Blakley Barbara and Barbara Blakley Family Trust
Purchase Details
Closed on
Mar 3, 2015
Sold by
Blakley Barbara
Bought by
Blakey Barbara and The Barbara Blakey Family Trust
Purchase Details
Closed on
Dec 2, 2009
Sold by
Bell Willa Mae
Bought by
Bell Willa Mae and The Willa Mae Bell Revocable Trust
Create a Home Valuation Report for This Property
The Home Valuation Report is an in-depth analysis detailing your home's value as well as a comparison with similar homes in the area
Home Values in the Area
Average Home Value in this Area
Purchase History
| Date | Buyer | Sale Price | Title Company |
|---|---|---|---|
| Blakley Barbara | -- | None Available | |
| Blakley Barbara A | -- | Fidelity National Title | |
| Blakley Barbara | -- | None Available | |
| Blakey Barbara | -- | None Available | |
| Bell Willa Mae | -- | None Available |
Source: Public Records
Mortgage History
| Date | Status | Borrower | Loan Amount |
|---|---|---|---|
| Open | Blakley Barbara A | $222,700 |
Source: Public Records
Tax History Compared to Growth
Tax History
| Year | Tax Paid | Tax Assessment Tax Assessment Total Assessment is a certain percentage of the fair market value that is determined by local assessors to be the total taxable value of land and additions on the property. | Land | Improvement |
|---|---|---|---|---|
| 2025 | $9,370 | $765,591 | $419,241 | $346,350 |
| 2024 | $9,288 | $750,580 | $411,021 | $339,559 |
| 2023 | $9,113 | $735,863 | $402,962 | $332,901 |
| 2022 | $8,697 | $721,435 | $395,061 | $326,374 |
| 2021 | $10,440 | $707,290 | $387,315 | $319,975 |
| 2020 | $9,641 | $629,939 | $383,344 | $246,595 |
| 2019 | $7,480 | $617,588 | $375,828 | $241,760 |
| 2018 | $7,377 | $605,479 | $368,459 | $237,020 |
| 2016 | $7,055 | $581,969 | $354,152 | $227,817 |
| 2015 | $682 | $47,276 | $25,681 | $21,595 |
| 2014 | $696 | $46,350 | $25,178 | $21,172 |
Source: Public Records
Map
Nearby Homes
- 1847 S Curson Ave
- 1849 Clyde Ave
- 1833 S Marvin Ave
- 1821 S Curson Ave
- 1747 S Marvin Ave
- 1741 S Marvin Ave
- 2012 S Curson Ave
- 1800 Carmona Ave
- 5563 Bangor St
- 1944 S Spaulding Ave
- 1815 Hauser Blvd
- 1741 S Spaulding Ave
- 5618 Venice Blvd
- 1728 Carmona Ave
- 1772 S Ogden Dr
- 1768 S Ogden Dr
- 5506 Venice Blvd
- 2108 Hauser Blvd
- 2202 Thurman Ave
- 2037 S Burnside Ave
- 1842 S Curson Ave Unit 1842 S Curson Ave
- 1842 S Curson Ave
- 1878 S Curson Ave
- 1783 S Marvin Ave
- 1809 S Marvin Ave
- 1883 S Curson Ave
- 1879 S Curson Ave
- 1889 S Curson Ave
- 1900 S Curson Ave
- 1789 S Marvin Ave
- 1875 S Curson Ave
- 1781 S Marvin Ave
- 1904 S Curson Ave
- 1823 S Marvin Ave
- 1866 S Curson Ave
- 1871 S Curson Ave
- 1891 S Curson Ave
- 1775 S Marvin Ave
- 1827 S Marvin Ave
- 1867 S Curson Ave